

Taxonomic identification of bile salt hydrolase-encoding lactobacilli: Modulation of the enterohepatic bile acid profile
- PMID: 38867937
- PMCID: PMC10989828
- DOI: 10.1002/imt2.128
Taxonomic identification of bile salt hydrolase-encoding lactobacilli: Modulation of the enterohepatic bile acid profile
Abstract
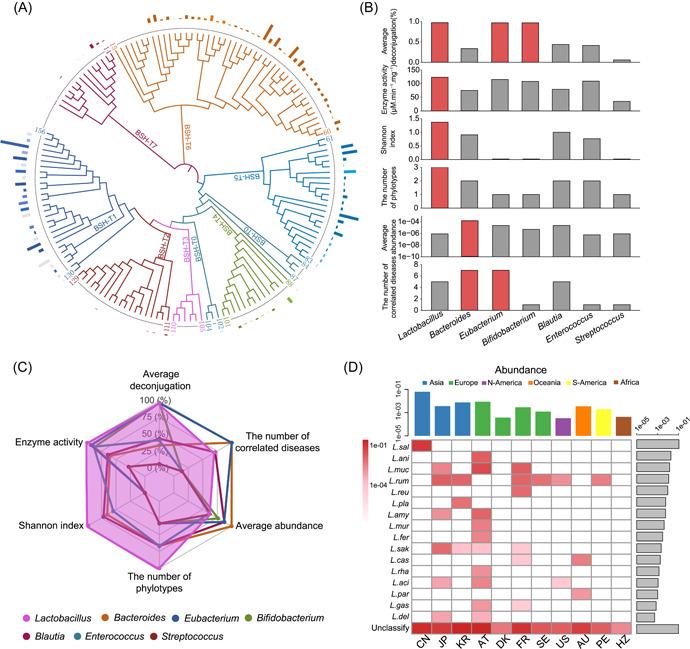
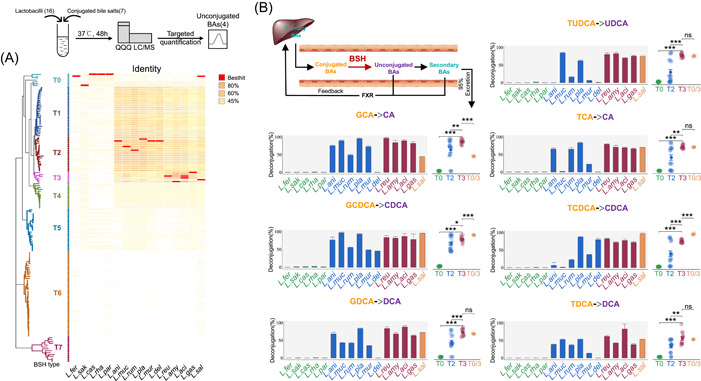
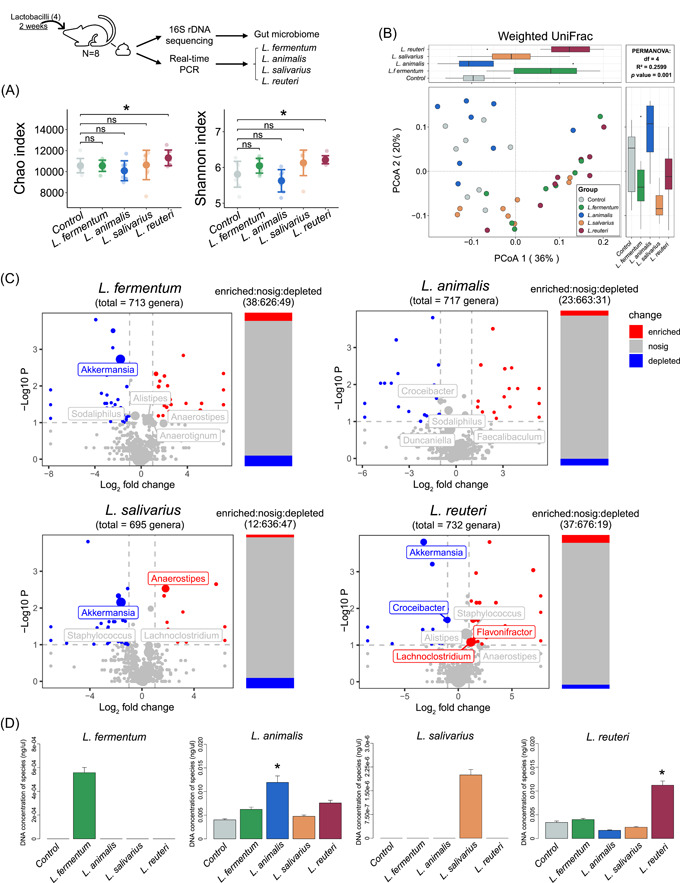
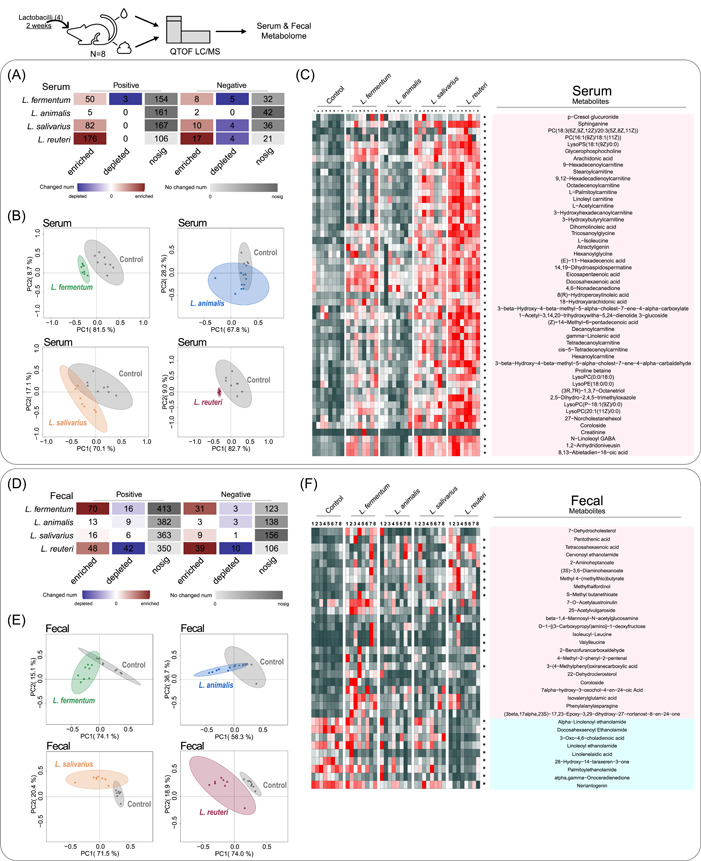
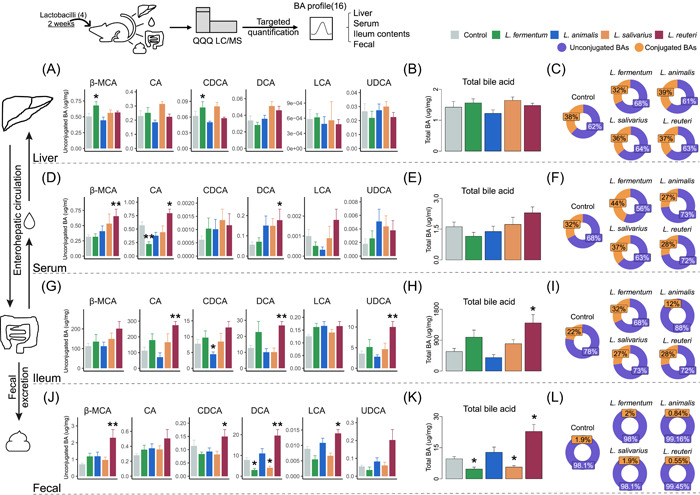
Bile salt hydrolases (BSHs) are enzymes that are essential for the enterohepatic metabolism of bile acids (BAs). BSHs catalyze the production of unconjugated BAs and regulate the homeostasis of BA pool. This study identified Lactobacillus as a crucial BSH-encoding genus, and 16 main species were obtained using metagenomic data from publicly available human gut microbiome databases. Then, the 16 species of lactobacilli were classified into four typical categories by BSH phylotypes, including five species encoding BSH-T0, six species encoding BSH-T2, four species encoding BSH-T3, and Ligilactobacillus salivarius encoding both BSH-T0 and BSH-T3. The lactobacilli with the highest in vitro deconjugation activities against seven conjugated BAs were the BSH-T3-encoding strains. Furthermore, in vivo studies in mice administered four representative lactobacilli strains encoding different BSH phylotypes showed that treatment with BSH-T3-encoding Limosilactobacillus reuteri altered the structure of the gut microbiome and metabolome and significantly increased the levels of unconjugated BAs and total BA excretion. Our findings facilitated the taxonomic identification of crucial BSH-encoding lactobacilli in human gut microbiota and shed light on their contributions toward modulation of the enterohepatic circulation of BAs, which will contribute to future therapeutic applications of BSH-encoding probiotics to improve human health.
Keywords: bile acid; bile salt hydrolase; gut microbiota; lactobacilli; phylotype.
© 2023 The Authors. iMeta published by John Wiley & Sons Australia, Ltd on behalf of iMeta Science.
Conflict of interest statement
The authors declare no conflict of interest.
Figures
Similar articles
-
New insights into microbial bile salt hydrolases: from physiological roles to potential applications.Front Microbiol. 2025 Feb 12;16:1513541. doi: 10.3389/fmicb.2025.1513541. eCollection 2025. Front Microbiol. 2025. PMID: 40012771 Free PMC article. Review.
-
Taxonomic profiling and populational patterns of bacterial bile salt hydrolase (BSH) genes based on worldwide human gut microbiome.Microbiome. 2019 Jan 23;7(1):9. doi: 10.1186/s40168-019-0628-3. Microbiome. 2019. PMID: 30674356 Free PMC article.
-
Lactobacillus bile salt hydrolase substrate specificity governs bacterial fitness and host colonization.Proc Natl Acad Sci U S A. 2021 Feb 9;118(6):e2017709118. doi: 10.1073/pnas.2017709118. Proc Natl Acad Sci U S A. 2021. PMID: 33526676 Free PMC article.
-
The Lactobacillus Bile Salt Hydrolase Repertoire Reveals Niche-Specific Adaptation.mSphere. 2018 May 30;3(3):e00140-18. doi: 10.1128/mSphere.00140-18. Print 2018 Jun 27. mSphere. 2018. PMID: 29848760 Free PMC article.
-
Targeting gut microbial bile salt hydrolase (BSH) by diet supplements: new insights into dietary modulation of human health.Food Funct. 2022 Jul 18;13(14):7409-7422. doi: 10.1039/d2fo01252a. Food Funct. 2022. PMID: 35766281 Review.
Cited by
-
Lactobacillus johnsonii CCFM1376 improves hypercholesterolemia in mice by regulating the composition of bile acids.Microbiome Res Rep. 2024 Nov 9;4(1):6. doi: 10.20517/mrr.2024.38. eCollection 2025. Microbiome Res Rep. 2024. PMID: 40207276 Free PMC article.
-
Comparative genome analysis of microbial strains marketed for probiotic interventions: an extension of the Integrated Probiotic Database.Microbiome Res Rep. 2024 Sep 3;3(4):45. doi: 10.20517/mrr.2024.11. eCollection 2024. Microbiome Res Rep. 2024. PMID: 39741953 Free PMC article.
-
New insights into microbial bile salt hydrolases: from physiological roles to potential applications.Front Microbiol. 2025 Feb 12;16:1513541. doi: 10.3389/fmicb.2025.1513541. eCollection 2025. Front Microbiol. 2025. PMID: 40012771 Free PMC article. Review.
-
Quercetin activates energy expenditure to combat metabolic syndrome through modulating gut microbiota-bile acids crosstalk in mice.Gut Microbes. 2024 Jan-Dec;16(1):2390136. doi: 10.1080/19490976.2024.2390136. Epub 2024 Aug 20. Gut Microbes. 2024. PMID: 39163273 Free PMC article.
-
Fecal bile acid profiles before and after fecal microbial transplant in pediatric onset ulcerative colitis.Gut Microbes Rep. 2024;1(1):2393219. doi: 10.1080/29933935.2024.2393219. Epub 2024 Sep 27. Gut Microbes Rep. 2024. PMID: 40734779 Free PMC article.
References
-
- Sayin, Sama I. , Wahlström Annika, Felin Jenny, Jäntti Sirkku, Marschall Hanns Ulrich, Bamberg Krister, Angelin Bo, et al. 2013. “Gut Microbiota Regulates Bile Acid Metabolism By Reducing the Levels Of Tauro‐Beta‐Muricholic Acid, A Naturally Occurring FXR Antagonist.” Cell Metabolism 17: 225–35. 10.1016/j.cmet.2013.01.003 - DOI - PubMed
LinkOut - more resources
Full Text Sources