. 2024 May 29;10(11):e32023.
doi: 10.1016/j.heliyon.2024.e32023. eCollection 2024 Jun 15.

Exposing kinetic disparities between inflammasome readouts using time-resolved analysis

Affiliations

Exposing kinetic disparities between inflammasome readouts using time-resolved analysis

Matthew Herring et al. Heliyon. .

Abstract

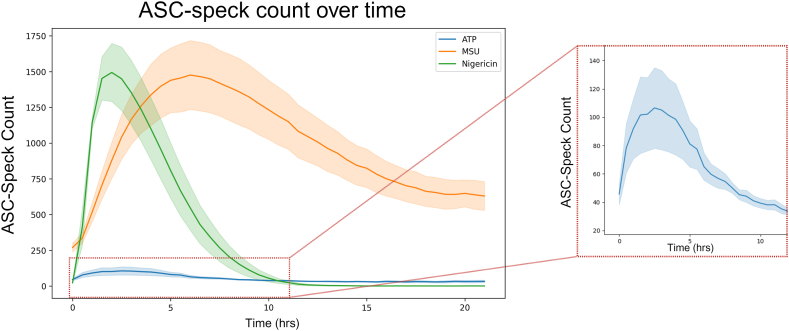
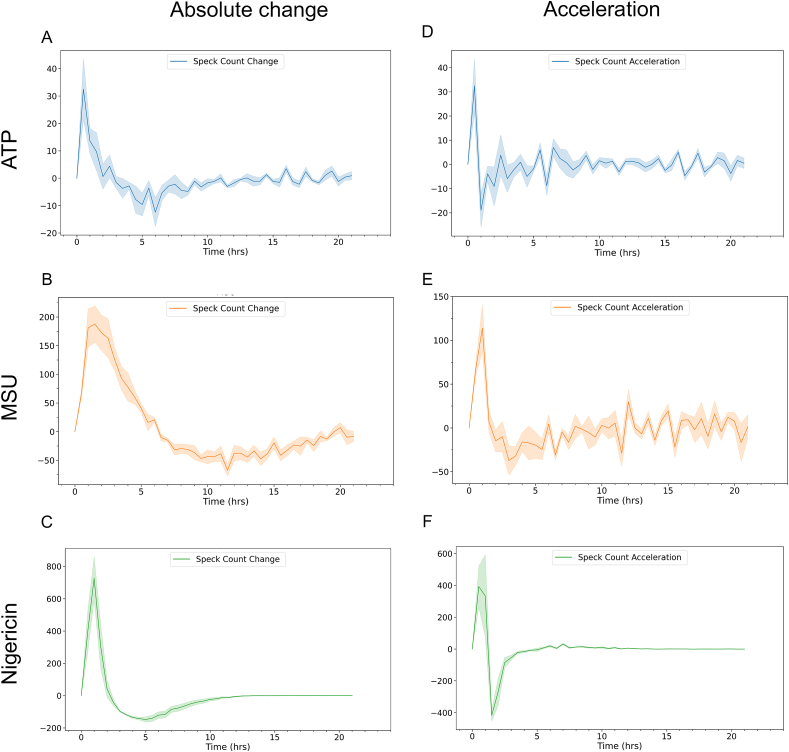
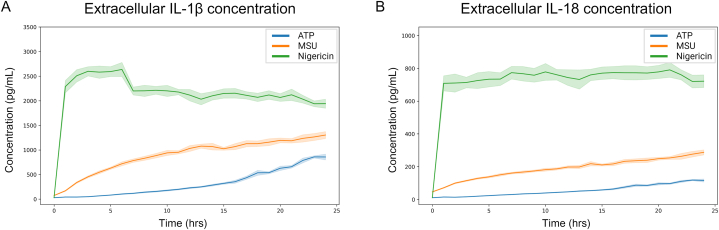
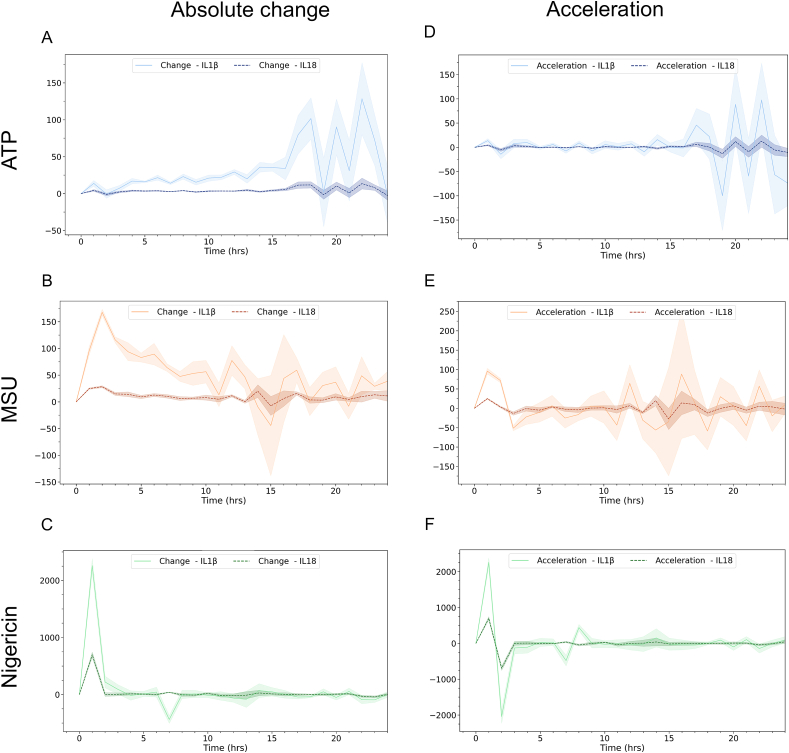
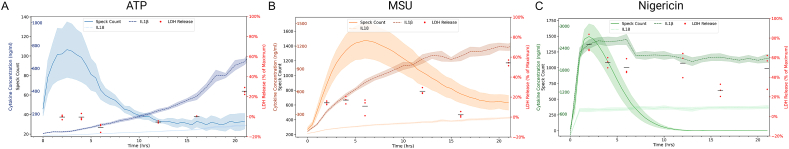
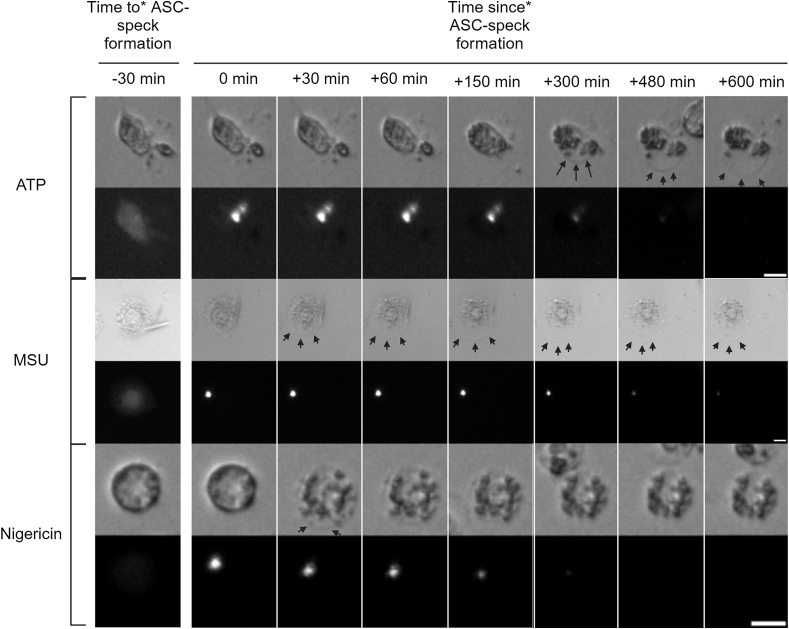
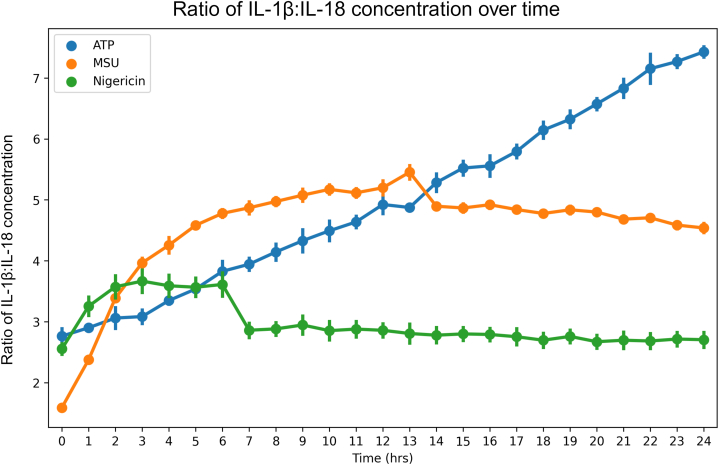
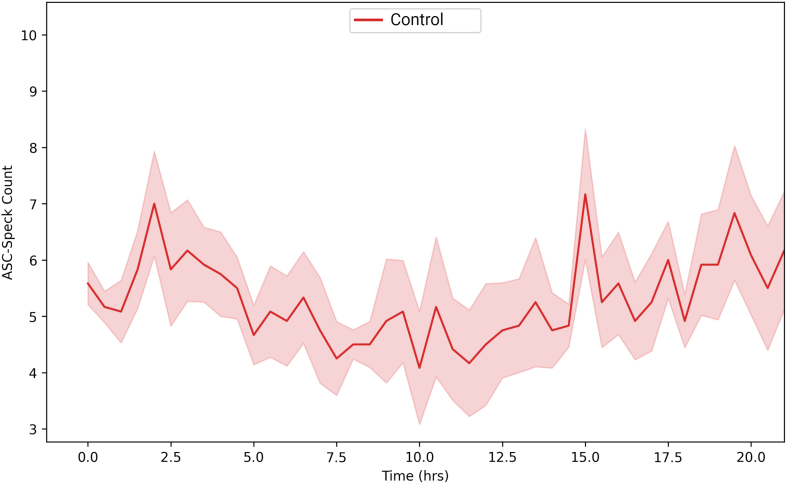
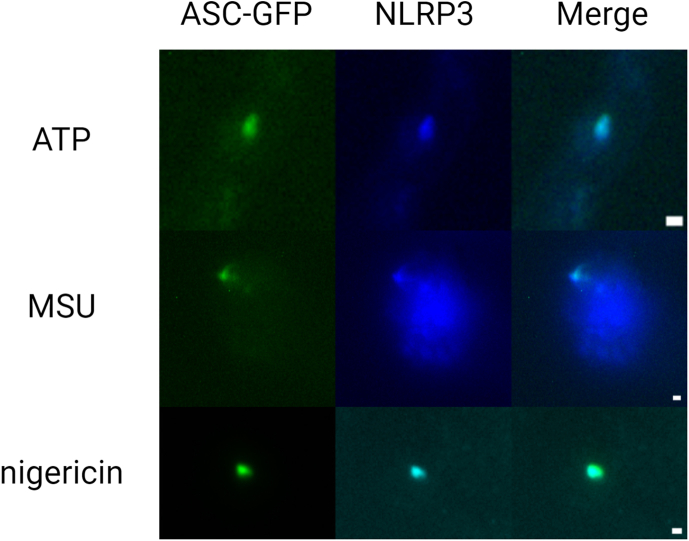
The NLRP3 inflammasome is an intracellular multiprotein complex described to be involved in both an effective host response to infectious agents and various diseases. Investigation into the NLRP3 inflammasome has been extensive in the past two decades, and often revolves around the analysis of a few specific readouts, including ASC-speck formation, caspase-1 cleavage or activation, and cleavage and release of IL-1β and/or IL-18. Quantification of these readouts is commonly undertaken as an endpoint analysis, where the presence of each positive outcome is assessed independently of the others. In this study, we apply time-resolved analysis of a human macrophage model (differentiated THP-1-ASC-GFP cells) to commonly accessible methods. This approach yields the additional quantifiable metrics time-resolved absolute change and acceleration, allowing comparisons between readouts. Using this methodological approach, we reveal (potential) discrepancies between inflammasome-related readouts that otherwise might go undiscovered. The study highlights the importance of time-resolved data in general and may be further extended as well as incorporated into other areas of research.

Keywords: ASC-Specks; Cell response; Cytokines; Human macrophages; LDH leakage; Live-cell imaging; NLRP3 inflammasome; THP-1 cells.


Conflict of interest statement

The authors declare the following financial interests/personal relationships which may be considered as potential competing interests:co-author affiliated to Nanoxis Consulting AB - R.K. If there are other authors, they declare that they have no known competing financial interests or personal relationships that could have appeared to influence the work reported in this paper.

Figures

Fig. 1
Fig. 1
ASC-speck dynamics differ between triggers. ASC-speck count in PMA-differentiated, LPS-primed THP-1 cells after triggering with ATP, MSU or nigericin. ASC-GFP specks were imaged every 30 min for 21 h by fluorescence microscopy and automatically quantified using the Weka segmentation plugin for ImageJ. Inset shows ATP triggered ASC-speck counts during the first 11 h. Data are represented as mean (solid line) ± SEM (shaded area), n = 5. Created with BioRender.com.
Fig. 2
Fig. 2
Time-resolved analysis allows for analysis of additional metrics. Quantifiable metrics of ASC-speck formation obtained by time-resolved analysis in PMA-differentiated, LPS-primed THP-1 cells. Absolute change (A–C) in ASC-speck number after triggering with A) ATP, B) MSU or C) nigericin and acceleration (D–F) of ASC-speck formation after triggering with D) ATP, E) MSU or F) nigericin. ASC-GFP specks were imaged every hour for 21 h by fluorescence microscopy and automatically quantified using the Weka segmentation plugin for ImageJ. Data is shown as mean (solid line) ± SEM (shaded area), n = 5. Created with BioRender.com.
Fig. 3
Fig. 3
Cytokine concentration differs with inflammasome trigger. IL-1β (A) and IL-18 (B) release was quantified after triggering of inflammasome activation with either ATP, MSU or nigericin in PMA-differentiated, LPS-primed THP-1 cells. Extracellular IL-1β and IL-18 were quantified using the MSD® U-PLEX Platform. Data is displayed as mean (solid line) ± SEM (shaded area), n = 5. Created with BioRender.com.
Fig. 4
Fig. 4
Cytokine change rates differ between triggers. Absolute change (A–C) and acceleration (D–F) of extracellular IL-1β (dashed line) and IL-18 (solid line) concentration after triggering inflammasome activation in PMA-differentiated, LPS-primed THP-1 cells with ATP (A and D), MSU (B and E) or nigericin (C and F). Extracellular IL-1β and IL-18 were quantified using the MSD® U-PLEX Platform. Data is shown as mean (solid or dashed line) ± SEM (shaded area), n = 5. Created with BioRender.com.
Fig. 5
Fig. 5
Temporal association between speck formation, cytokine release and LDH leakage varies with activating signal. After triggering NLRP3 inflammasome activation with either ATP (A), MSU (B) or nigericin (C) in PMA-differentiated, LPS-primed THP-1 cells, the temporal association of ASC-speck count, extracellular IL-1β concentration, extracellular IL-18 concentration, and extracellular LDH was assessed. ASC-GFP specks were imaged by fluorescent microscopy and automatically quantified using the Weka segmentation plugin for ImageJ. IL-1β concentration and IL-18 concentration were quantified using the MSD® U-PLEX Platform. LDH was quantified using the CyQuant™ LDH Cytotoxicity Assay Kit. Speck count, IL-1β concentration and IL-18 concentration are shown as mean (solid line, dark dashed line and light dashed line, respectively) ± SEM (shaded area). LDH is shown as individual data points (red dots) with the mean (black dash). Created with BioRender.com. (For interpretation of the references to colour in this figure legend, the reader is referred to the Web version of this article.)
Fig. 6
Fig. 6
Time from ASC-speck formation to cellular swelling differs with inflammasome trigger. Temporal association between ASC-speck formation and cellular swelling in PMA-differentiated, LPS-primed THP-1-ASC-GFP cells after triggering ASC-speck formation with either ATP, MSU or nigericin. Images were obtained every 30 min for 21 h *Speck formation may have occurred at any time during the 30 min leading up to (time to) or since (time since) the indicated time point. Scale bars are 10 μm. Created with BioRender.com.
Fig. 7
Fig. 7
IL-1β:IL-18 ratios vary with triggers. Extracellular concentrations of IL-1β and IL-18 from PMA-differentiated, LPS- primed THP-1 cells after triggering with either ATP, MSU or nigericin were quantified using the MSD® U-PLEX Platform. The ratio IL-1β:IL-18 was calculated by dividing IL-1β concentration by IL-18 concentration. Data is shown as mean ± SEM, n = 5. Created with BioRender.com.
None
figs1. ASC-GFP speck count in untreated controls. ASC-speck count in PMA-differentiated THP-1 cells. ASC-GFP specks were imaged every 30 min for 24 hours by fluorescence microscopy and automatically quantified using the Weka segmentation plugin for ImageJ. Data are represented as mean (solid line) ± SEM (shaded area), n = 6. Created with BioRender.com.
figs2
figs2
Co-localization of ASC-GFP and NLRP3. Co-localization was assessed after triggering NLRP3 inflammasome formation with either 5 mM ATP (2h), 100µg/mL MSU (5h) or 10µM nigericin (30min) in PMA-differentiated, LPS-primed THP-1-ASC-GFP cells. Cells were imaged using the EVOS™ M7000 Imaging System, 40X objective and DAPI and GFP light cube. Scale bars are 1µm. Created with BioRender.com.

Similar articles

Cited by

References

    1. Dagenais M., Skeldon A., Saleh M. The inflammasome: in memory of Dr. Jurg Tschopp. Cell Death & Differentiation. 2012;19:5–12. doi: 10.1038/cdd.2011.159. - DOI - PMC - PubMed
    1. Stutz A., Horvath G.L., Monks B.G., Latz E. ASC speck formation as a readout for inflammasome activation. Methods Mol Biol. 2013;1040:91–101. doi: 10.1007/978-1-62703-523-1_8. - DOI - PubMed
    1. Soriano-Teruel P.M., García-Laínez G., Marco-Salvador M., Pardo J., Arias M., DeFord C., Merfort I., Vicent M.J., Pelegrín P., Sancho M., Orzáez M. Identification of an ASC oligomerization inhibitor for the treatment of inflammatory diseases. Cell Death & Disease. 2021;12:1155. doi: 10.1038/s41419-021-04420-1. - DOI - PMC - PubMed
    1. Lučiūnaitė A., McManus R.M., Jankunec M., Rácz I., Dansokho C., Dalgėdienė I., Schwartz S., Brosseron F., Heneka M.T. Soluble Aβ oligomers and protofibrils induce NLRP3 inflammasome activation in microglia. Journal of Neurochemistry. 2020;155:650–661. doi: 10.1111/jnc.14945. - DOI - PubMed
    1. Zhen D., Xuan T.-q., Hu B., Bai X., Fu D.-n., Wang Y., Wu Y., Yang J., Ma Q. Pteryxin attenuates LPS-induced inflammatory responses and inhibits NLRP3 inflammasome activation in RAW264.7 cells. Journal of Ethnopharmacology. 2022;284 doi: 10.1016/j.jep.2021.114753. - DOI - PubMed

LinkOut - more resources