

Lipidomics analysis reveals new insights into crisp grass carp associated with meat texture
- PMID: 38868033
- PMCID: PMC11168433
- DOI: 10.1016/j.heliyon.2024.e32179
Lipidomics analysis reveals new insights into crisp grass carp associated with meat texture
Abstract
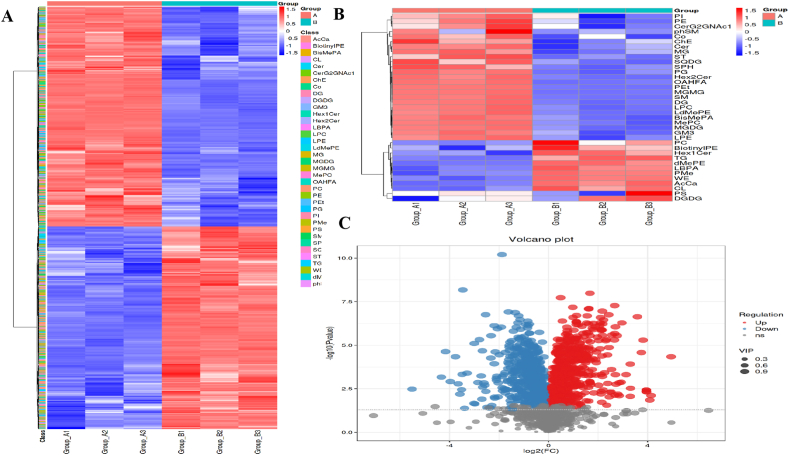
Feeding faba beans to grass carp could crisp its muscle texture to avoid softening, the relationship between texture formation throughout the crisping process and the critical lipids regulating the fish quality has not yet been clarified. Herein, an 60-day nutritional trial and untargeted lipidomic analysis was used to study the changes of lipids in crisp grass carp dorsal muscle. A total of 1036 lipids were remarkably different between ordinary and crisp grass carp. The concentrations of the LPC, LPE, PG, Cer, Hex2Cer, SM, MG and MGMG were positively correlated with hardness and springiness, and the CL, TG, PMe, WE, dMePE and AcCa were negative correlation. High content of lipids involved in storage in ordinary grass carp, such as glycerophospholipids, polyunsaturated and saturated fatty acid content. In contrast, high content of membrane components in crisp grass carp, such as monounsaturated fatty acid, sphingolipid and glycerolipids content, and the distribution of PUFA in lipid molecules was related to lipid biosynthesis. This study might provide some insights into improved knowledge of the association between meat texture and lipid molecules in fish fed with faba bean.
Keywords: Crisp grass carp; Faba bean; Lipidomics; Meat texture.
© 2024 The Authors.
Conflict of interest statement
The authors declare that they have no known competing financial interests or personal relationships that could have appeared to influence the work reported in this paper.
Figures


Similar articles
-
EccDNA Analysis Provides Novel Insights Into the Molecular Mechanism of Firmness of Fish Fillet.Food Sci Nutr. 2025 May 13;13(5):e70268. doi: 10.1002/fsn3.70268. eCollection 2025 May. Food Sci Nutr. 2025. PMID: 40365041 Free PMC article.
-
Lipid accumulation in grass carp (Ctenopharyngodon idellus) fed faba beans (Vicia faba L.).Fish Physiol Biochem. 2019 Apr;45(2):631-642. doi: 10.1007/s10695-018-0589-7. Epub 2018 Nov 20. Fish Physiol Biochem. 2019. PMID: 30460475
-
Comparative genome-wide methylation analysis reveals epigenetic regulation of muscle development in grass carp (Ctenopharyngodon idellus) fed with whole faba bean.PeerJ. 2022 Nov 21;10:e14403. doi: 10.7717/peerj.14403. eCollection 2022. PeerJ. 2022. PMID: 36438576 Free PMC article.
-
Manipulating meat quality and composition.Proc Nutr Soc. 1999 May;58(2):363-70. doi: 10.1017/s0029665199000488. Proc Nutr Soc. 1999. PMID: 10466178 Review.
-
Fatty Acid Composition of Grain- and Grass-Fed Beef and Their Nutritional Value and Health Implication.Food Sci Anim Resour. 2022 Jan;42(1):18-33. doi: 10.5851/kosfa.2021.e73. Epub 2022 Jan 1. Food Sci Anim Resour. 2022. PMID: 35028571 Free PMC article. Review.
Cited by
-
Optimizing Muscle Quality in Common Carp (Cyprinus carpio L.): Impacts of Body Size on Nutrient Composition, Texture, and Volatile Profile.Foods. 2025 Aug 11;14(16):2794. doi: 10.3390/foods14162794. Foods. 2025. PMID: 40870706 Free PMC article.
-
EccDNA Analysis Provides Novel Insights Into the Molecular Mechanism of Firmness of Fish Fillet.Food Sci Nutr. 2025 May 13;13(5):e70268. doi: 10.1002/fsn3.70268. eCollection 2025 May. Food Sci Nutr. 2025. PMID: 40365041 Free PMC article.
-
Multi-Omics Profiling of Lipid Variation and Regulatory Mechanisms in Poultry Breast Muscles.Animals (Basel). 2025 Feb 27;15(5):694. doi: 10.3390/ani15050694. Animals (Basel). 2025. PMID: 40075981 Free PMC article.
References
-
- Xu W., Guo H., Chen S., Wang Y., Lin Z., Huang X., Tang H., He Y., Sun J., Gan L. Transcriptome analysis revealed changes of multiple genes involved in muscle hardness in grass carp (Ctenopharyngodon idellus) fed with faba bean meal. Food Chem. 2020;314 doi: 10.1016/j.foodchem.2020.126205. - DOI - PubMed
LinkOut - more resources
Full Text Sources
Research Materials
Miscellaneous
