. 2024 May 18;27(6):109985.
doi: 10.1016/j.isci.2024.109985. eCollection 2024 Jun 21.

Mapping the emotional homunculus with fMRI

Affiliations

Mapping the emotional homunculus with fMRI

Michelle Giraud et al. iScience. .

Abstract

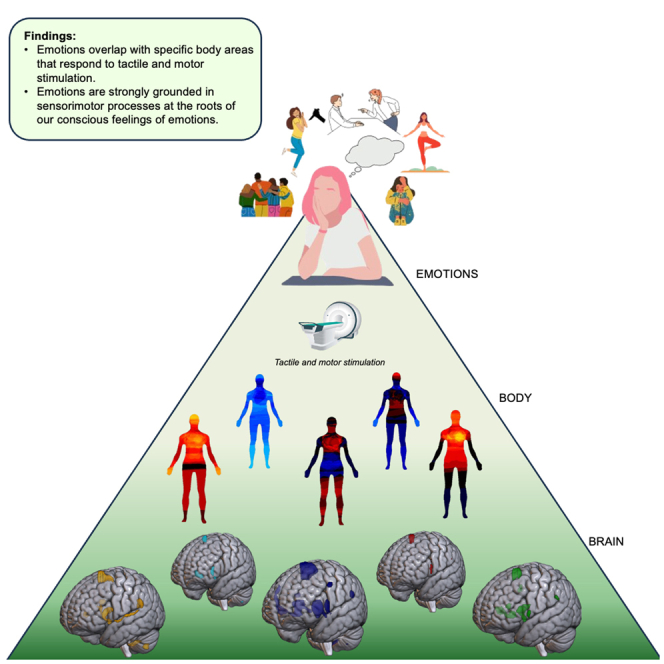
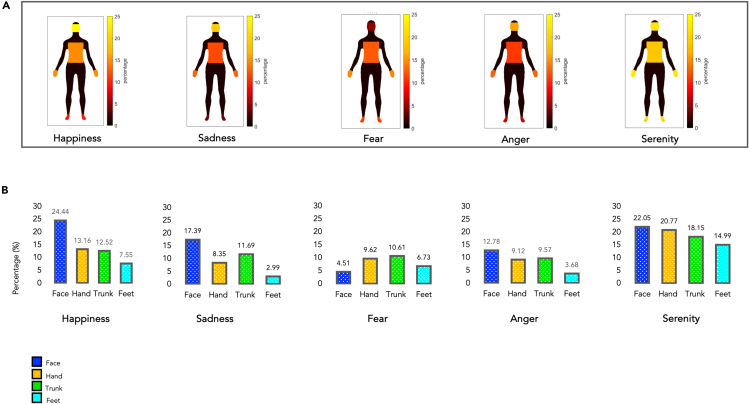
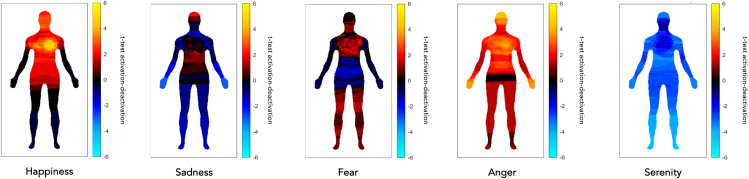
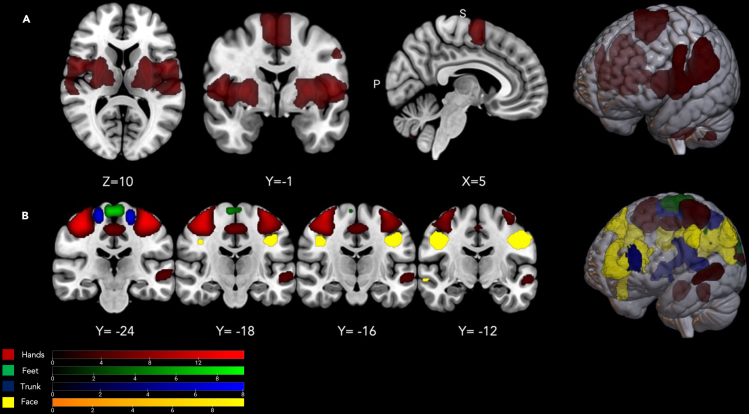
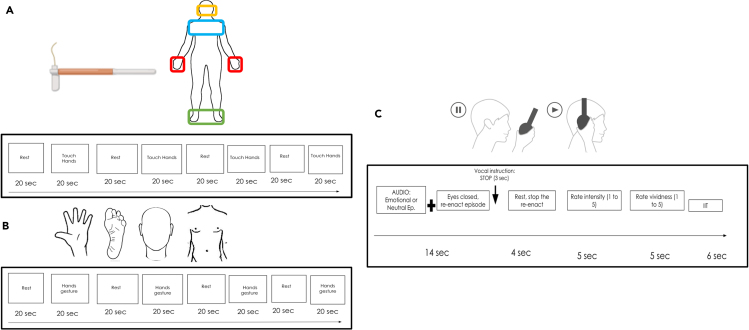
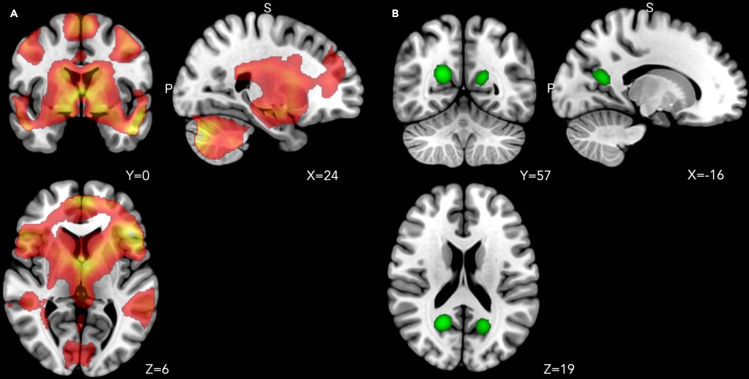
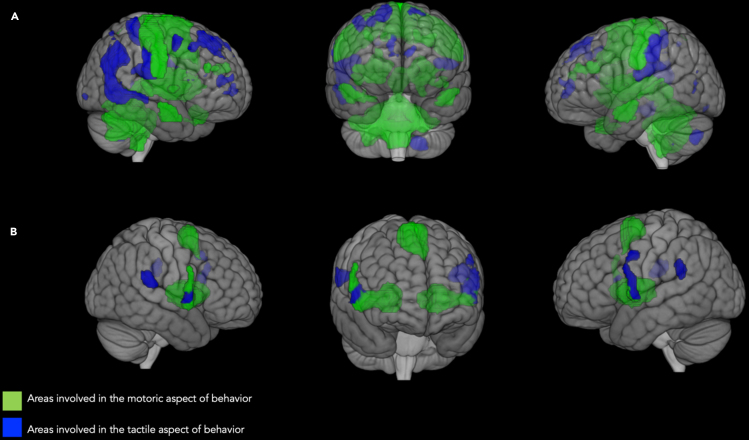
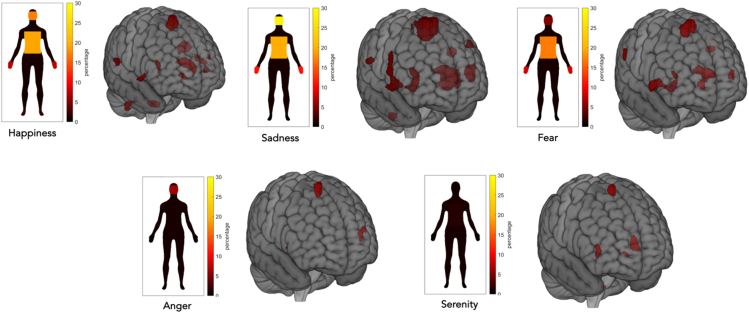
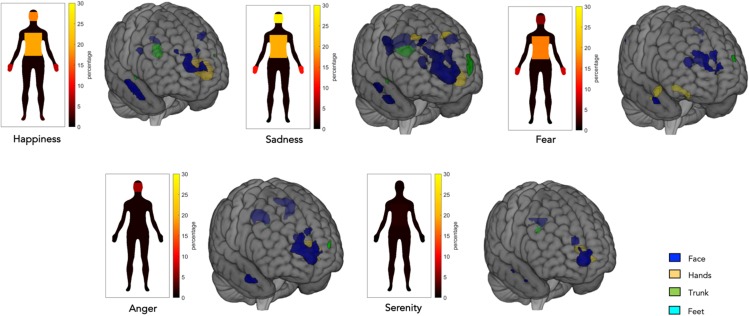
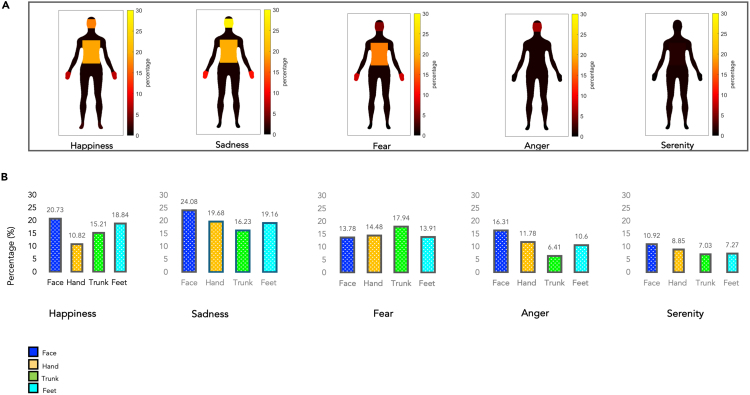
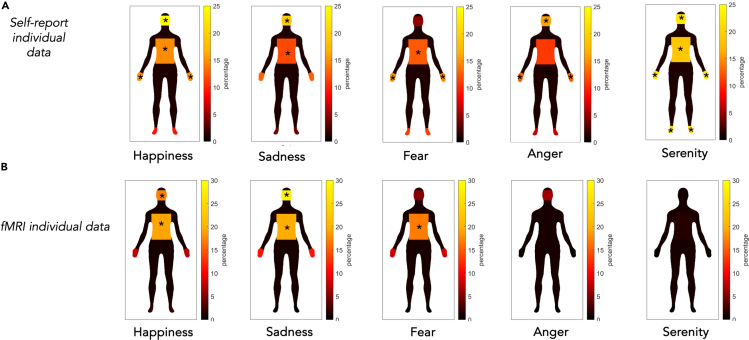
Emotions are commonly associated with bodily sensations, e.g., boiling with anger when overwhelmed with rage. Studies have shown that emotions are related to specific body parts, suggesting that somatotopically organized cortical regions that commonly respond to somatosensory and motor experiences might be involved in the generation of emotions. We used functional magnetic resonance imaging to investigate whether the subjective feelings of emotion are accompanied by the activation of somatotopically defined sensorimotor brain regions, thus aiming to reconstruct an "emotional homunculus." By defining the convergence of the brain activation patterns evoked by self-generated emotions during scanning onto a sensorimotor map created on participants' tactile and motor brain activity, we showed that all the evoked emotions activated parts of this sensorimotor map, yet with considerable overlap among different emotions. Although we could not find a highly specific segmentation of discrete emotions over sensorimotor regions, our results support an embodied experience of emotions.

Keywords: behavioral neuroscience; cognitive neuroscience; neuroscience.


Conflict of interest statement

The authors declare no competing interests.

Figures

None
Graphical abstract
Figure 1
Figure 1
The subjective experience of emotions: single-subject analysis on self-reports silhouettes (A) Emotional homunculi based on subjective self-reports. Digitization of the colored silhouettes by the participants. Each silhouette was divided into four discrete body districts, the same ones used during the functional imaging tasks. Within each body segment, the percentage of colored pixels in that specific body part was calculated. (B) Graphical representation (in percentages) of the distribution of emotions across discrete body parts (i.e., face, hands, trunk, feet; Bayesian one-sample t test all BF > 2.75, except sadness on feet [BF = 0.55] and anger on feet [BF = 0.61]).
Figure 2
Figure 2
The digitalized subject-wise body-emotion maps Result of the digitalized subject-wise bodily sensations maps. Each map was obtained by subtracting the deactivation map from the activation map. Warm colors indicate increasing activation (e.g., feeling muscle movements, the temperature increasing, or increasing heartbeat, etc.), while cool colors represent decreasing activation (e.g., feeling relaxed muscle, freezing sensation, decreasing heartbeat, etc.). The color bar shows the t-statistic range.
Figure 3
Figure 3
Brain regions with neurons mapping the whole body or specific-body-segments effects (A) Brain regions that resulted significantly active for the conjunction of Motor and Tactile localizer tasks for all body segments. All the data are reported by applying the same statistical threshold reported in the tables and discussed in the text (puncorr < 0.001 at the voxel level and pFWER-corr < 0.05 at the cluster level). (B) Brain regions that resulted significantly active for the contrast “Face movements & Face tactile stimulation > all the other body segments movements & tactile stimulation,” “Hands movements & Hand tactile stimulation > all the other body segments movements & tactile stimulation,” “Trunk movements & Trunk tactile stimulation > all the other body segments movements & tactile stimulation,” “Feet movements & Feet tactile stimulation > all the other body segments movements & tactile stimulation.” All the data are reported by applying the same statistical threshold reported in the tables and discussed in the text (puncorr < 0.001 at the voxel level and pFWER-corr < 0.05 at the cluster level).
Figure 4
Figure 4
Experimental design (A) Somatosensory functional localizer task procedure. Each participant was bilaterally stimulated using Von Frey filaments 60 gr. (B) Motor functional localizer task procedure. Each participant performed specific movements using their hands, feet, trunk, and face. (C) Emotional recall task procedure. Each participant heard through headphones 14s of emotional autobiographical episodes followed by neutral autobiographical episodes in random order.
Figure 5
Figure 5
Brain activity evoked by the emotional recall task (A) Brain regions that resulted significantly active for the contrast “Emotional episodes > Neutral episodes.” All the data are reported by applying the same statistical threshold reported in the tables and discussed in the text (puncorr < 0.001 at the voxel level and pFWER-corr < 0.05 at the cluster level). (B) Brain regions that resulted significantly active for the contrast “Neutral episodes > Emotional episodes.” All the data are reported by applying the same statistical threshold reported in the tables and discussed in the text (puncorr < 0.001 at the voxel level and pFWER-corr < 0.05 at the cluster level).
Figure 6
Figure 6
The intersection of emotional recall on whole-body brain areas (A) Intersection areas of individual body parts involved in the motor and tactile aspects, defined as a single conjunction effect. Here, a distinction is made between regions more active for the motor localizer task (in green) or for the tactile localizer task (in blue). All the data are reported by applying the same statistical threshold reported in the tables and discussed in the text (puncorr < 0.001 at the voxel level and pFWER-corr < 0.05 at the cluster level). (B) Anatomical overlap of the main effect of the emotional recall task and regions with neurons responding to all body segments tested, a distinction is made between regions more active for the motor localizer task (in green) or for the tactile localizer task (in blue). All the data are reported by applying the same statistical threshold reported in the tables and discussed in the text (puncorr < 0.001 at the voxel level and pFWER-corr < 0.05 at the cluster level).
Figure 7
Figure 7
Discrete emotions and the whole-body sensorimotor map Overlay of the five discrete emotion maps onto the sensorimotor whole-body map. Note that all emotions significantly overlapped with the conjunction map of the localizer scans. All the data are reported by applying the same statistical threshold reported in the tables and discussed in the text (puncorr < 0.001 at the voxel level and pFWER-corr < 0.05 at the cluster level).
Figure 8
Figure 8
Discrete emotions and body-segments-specific maps Overlay of the five discrete emotion maps onto the discrete body-segments maps based on group-level analyses. Note that all emotions significantly overlapped with the specific four body-segment maps, except for feet in happiness and in fear, which showed no selective voxels activation. All the data are reported by applying the same statistical threshold reported in the tables and discussed in the text (puncorr < 0.001 at the voxel level and pFWER-corr < 0.05 at the cluster level).
Figure 9
Figure 9
The subjective experience of emotions: single-level analysis on brain activations (A) Emotional homunculi based on brain activation at single-subject level analysis. Each silhouette was divided into four discrete body districts, the same ones used during the functional imaging tasks. Within each body segment, the percentage of brain activations in that specific body part was calculated. (B) Graphical representation (in percentages) of the distribution of emotions across discrete body parts (i.e., face, hands, trunk, feet; Bayesian one-sample t test all BF > 7.00, except for serenity in feet [BF = 1.69] and trunk in feet [BF = 1.35]). The voxel-wise threshold applied to the statistical maps before cluster correction was p < 0.05 uncorrected to maximize the chance of detecting effects in the less sensitive single-subject fixed-effect analyses.
Figure 10
Figure 10
Congruence between body distribution of emotions as depicted by self-reports and fMRI The comparison between the silhouettes created by participants’ self-reports (i.e., digitized from the emBODY pen-and-paper task) and the silhouettes created by individual participants’ brain activation at single-subject level analysis. Both figures were created by considering the percentage of active pixels or voxels on the total surface area of a specific body parts (i.e., face, hands, trunk, and feet). The asterisks indicate hotspots, i.e., defined as body parts with maximal intensity. (A) Digitalized silhouettes from self-report individual data. (B) Digitalized silhouettes based on brain activation at single-subject level analysis (e.g., fMRI individual data).

Similar articles

Cited by

References

    1. Carr E.W., Kever A., Winkielman P. In: The Oxford Handbook of 4E Cognition. Newen A., De Bruin L., Gallagher S., editors. Oxford University Press; 2018. Embodiment of emotion and its situated nature; pp. 528–552. - DOI
    1. Peña Cervel S. A cognitive approach to the role of body parts in the conceptualization of emotion metaphors. Epos Rev. Filol. 2013;245:351–356. doi: 10.5944/epos.17.2001.10188. - DOI
    1. Lakoff G. In: Metaphor and thought. 2nd ed. Ortony A., editor. Cambridge University Press; 1993. The contemporary theory of metaphor; pp. 202–251. - DOI
    1. Kovecses Z. Cambridge University Press; 2008. Metaphor and emotion. In The Cambridge Handbook of Metaphor and Thought. pp. 380–396.
    1. Damasio A., Carvalho G.B. The nature of feelings: evolutionary and neurobiological origins. Nat. Rev. Neurosci. 2013;14:143–152. doi: 10.1038/nrn3403. - DOI - PubMed

LinkOut - more resources