. 2024 May 15;27(6):109995.
doi: 10.1016/j.isci.2024.109995. eCollection 2024 Jun 21.

ESR1 and p53 interactome alteration defines mechanisms of tamoxifen response in luminal breast cancer

Affiliations

ESR1 and p53 interactome alteration defines mechanisms of tamoxifen response in luminal breast cancer

Chetan C Oturkar et al. iScience. .

Abstract

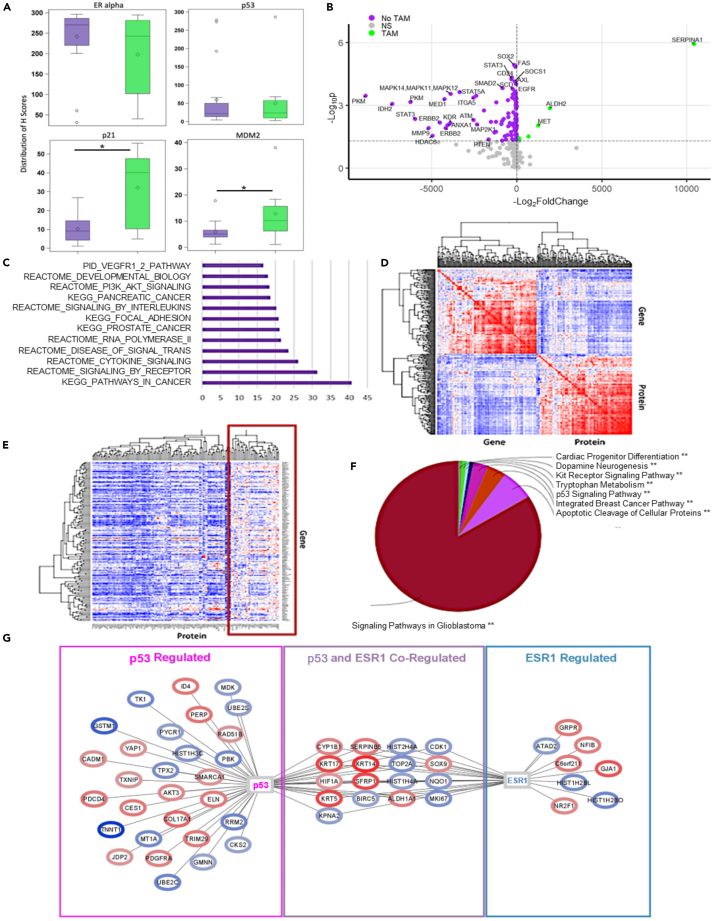
The canonical mechanism behind tamoxifen's therapeutic effect on estrogen receptor α/ESR1+ breast cancers is inhibition of ESR1-dependent estrogen signaling. Although ESR1+ tumors expressing wild-type p53 were reported to be more responsive to tamoxifen (Tam) therapy, p53 has not been factored into choice of this therapy and the mechanism underlying the role of p53 in Tam response remains unclear. In a window-of-opportunity trial on patients with newly diagnosed stage I-III ESR1+/HER2/wild-type p53 breast cancer who were randomized to arms with or without Tam prior to surgery, we reveal that the ESR1-p53 interaction in tumors was inhibited by Tam. This resulted in functional reactivation of p53 leading to transcriptional reprogramming that favors tumor-suppressive signaling, as well as downregulation of oncogenic pathways. These findings illustrating the convergence of ESR1 and p53 signaling during Tam therapy enrich mechanistic understanding of the impact of p53 on the response to Tam therapy.

Keywords: Cancer; Health sciences; Transcriptomics.


Conflict of interest statement

The authors declare no competing interests.

Figures

None
Graphical abstract
Figure 1
Figure 1
Consort diagram of the clinical trial See also Tables S1–S3.
Figure 2
Figure 2
Schema representing study design, eligibility, and endpoints of the clinical trial
Figure 3
Figure 3
Tamoxifen metabolites in the tumor tissue and plasma Mass spectrometry-based measurement of key metabolites from the tamoxifen metabolic pathway was measured in patient plasma and tumor samples. Mean abundance in plasma and tumor samples is reported in the table (bottom). p value obtained from Student’s t test comparing mean plasma and tumor abundance. Network-relating metabolites were constructed (metabolites, rectangles) highlighting metabolites increased in the tumor, as compared to plasma (red), metabolites decreased in the tumor, as compared to the plasma (blue), and metabolites that were not significantly altered between the two sample types (gray). See also Table S4.
Figure 4
Figure 4
Tamoxifen disrupts ESR1-p53 interaction in breast cancer patient tumors ESR1-p53 interaction in tamoxifen-treated versus untreated tumor tissue was assayed by bright-field PLA with primary antibodies against ERα (HC20) and p53 (DO1) (Santa Cruz Biotechnology) on breast cancer patient TMA. (A) Representative images of tumor tissue IHC for ERα & p53 and their corresponding PLA interactions are shown. (B) Quantification of PLA scores for ERα-p53 interaction in tamoxifen-treated vs. untreated tumor is shown on the right panels. Scale bar – PLA, 20 μm and IHC, 100 μm. Data are represented as mean ± SEM. Statistical significance was determined by a Student’s t test. p = 0.0053. See also Table S4.
Figure 5
Figure 5
Distinct transcriptomics profile in tumors from tamoxifen-treated versus untreated (standard of care) patients (A) Principal component analysis of the top 307 differentially expressed genes divided patients into no Tam intervention (U, purple) and Tam-treated groups (T, green) with a good amount of confidence based on a measure of variation using eigen vectors. (B) The differentially expressed genes (p < 0.05, |logFC|>1.5, red) are displayed in a volcano plot, where upregulated genes in T versus U are to the right, and downregulated genes are to the left. (C) Heatmap displaying the up- (red) and down- (blue) regulated genes in each cluster. The genes show separation of Tam intervention (T, green) as compared to non-Tam intervention (U, purple) via Euclidean distances. (D) Representative GSEA plots demonstrating genes enriching for several important and relevant gene sets, such as luminal A and stem cell markers (upper panel) in the treated samples, and high tumor grade and proliferation in the untreated samples (lower panel). (E) A summary of the normalized enrichment scores (NES) of the top 12 positively (enriched in the treated group, red) and negatively (enriched in the untreated, blue) regulated pathways are plotted and include several pathways involved in epigenetic regulation, cell cycle, and tumor suppressor gene function. (F) Differentially expressed genes (purple) enriched for master regulators (green) using iRegulon, which were then used to construct a network based on top enrichment scores (left panel), and the number of targets present for each of the master regulators (right panel). See also Figures S1 and S2, and Table S4.
Figure 6
Figure 6
Integration of transcriptomics and proteomics reveals regulatory crosstalk between ESR1 and p53 (A) To assess differential protein expression in response to tamoxifen treatment, IHC with antibodies against selected proteins was performed on tumor tissues arrayed in triplicate on TMAs. Data are represented as mean ± SEM. ∗ represents p ≤ 0.05. (B) Differential protein expression was further analyzed by RPPA. Of the 210 proteins detected by RPPA, only 84 corresponding genes were found to be significantly dysregulated by both adjusted p value and logFC. (C) The 84 genes were further enriched for gene sets of interest, and the top 12 significantly enriched pathways by the –log10 of the false discovery rate corrected p-value were plotted. These included pathways involved in developmental biology and important signal transduction and signaling cascades. (D) A correlation heatmap using the 84 differentially expressed proteins and their matched transcriptomics data to understand how well the expression of the genes and proteins correlated with one another. (E) Heatmap showing a small subset of genes that were positively correlated with their protein expression. (F) The subset of genes was further enriched for the types of pathways they are heavily involved in. The largest proportion was found to be involved in several signaling pathways including apoptosis and p53 signaling as well as breast cancer hormonal pathways. (G) A subnetwork exploring the relationship between proteins and transcripts that were differentially expressed (ovals) were used to identify those proteins regulated by TP53 alone (blue), ESR1 alone (red), or co-regulated by both TP53 and ESR1 (purple), which are also known to regulate each other. Differential expression of those genes was assessed (oval outline: blue is downregulated and red is upregulated). See also Table S4.

Similar articles

Cited by

  • Cardiotoxicity of breast cancer drug treatments.
    Haque M, Atallah N, Patke R, Harris AE, Woodcock CL, Varun D, Thompson RL, Jackson-Oxley J, Okui CH, Dean A, Alsaleem M, Rakha E, Irshad S, Davis MB, Jeyapalan JN, Mongan NP, Rutland CS. Haque M, et al. Transl Oncol. 2025 May;55:102352. doi: 10.1016/j.tranon.2025.102352. Epub 2025 Mar 15. Transl Oncol. 2025. PMID: 40090070 Free PMC article.
  • Interaction between Estrogen Receptors and p53: A Broader Role for Tamoxifen?
    Das GM, Oturkar CC, Menon V. Das GM, et al. Endocrinology. 2025 Feb 5;166(3):bqaf020. doi: 10.1210/endocr/bqaf020. Endocrinology. 2025. PMID: 39891710 Free PMC article. Review.

References

    1. Heer E., Harper A., Escandor N., Sung H., McCormack V., Fidler-Benaoudia M.M. Global burden and trends in premenopausal and postmenopausal breast cancer: a population-based study. Lancet Global Health. 2020;8:e1027–e1037. doi: 10.1016/S2214-109X(20)30215-1. - DOI - PubMed
    1. Jensen E.V., Jordan V.C. The estrogen receptor: a model for molecular medicine. Clin. Cancer Res. 2003;9:1980–1989. - PubMed
    1. Howell A., Howell S.J. Tamoxifen evolution. Br. J. Cancer. 2023;128:421–425. doi: 10.1038/s41416-023-02158-5. - DOI - PMC - PubMed
    1. Group E.B.C.T.C. Tamoxifen for early breast cancer: an overview of the randomised trials. Early Breast Cancer Trialists' Collaborative Group. Lancet. 1998;351:1451–1467. - PubMed
    1. Davies C., Pan H., Godwin J., Gray R., Arriagada R., Raina V., Abraham M., Medeiros Alencar V.H., Badran A., Bonfill X., et al. Long-term effects of continuing adjuvant tamoxifen to 10 years versus stopping at 5 years after diagnosis of oestrogen receptor-positive breast cancer: ATLAS, a randomised trial. Lancet. 2013;381:805–816. doi: 10.1016/S0140-6736(12)61963-1. - DOI - PMC - PubMed