. 2024 May 16;27(6):110012.
doi: 10.1016/j.isci.2024.110012. eCollection 2024 Jun 21.

Distinct features of ribonucleotides within genomic DNA in Aicardi-Goutières syndrome ortholog mutants of Saccharomyces cerevisiae

Affiliations

Distinct features of ribonucleotides within genomic DNA in Aicardi-Goutières syndrome ortholog mutants of Saccharomyces cerevisiae

Deepali L Kundnani et al. iScience. .

Abstract

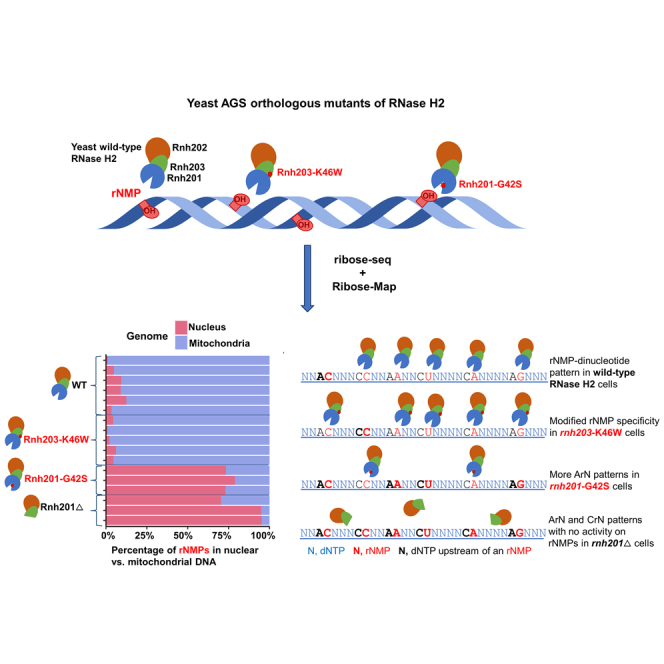
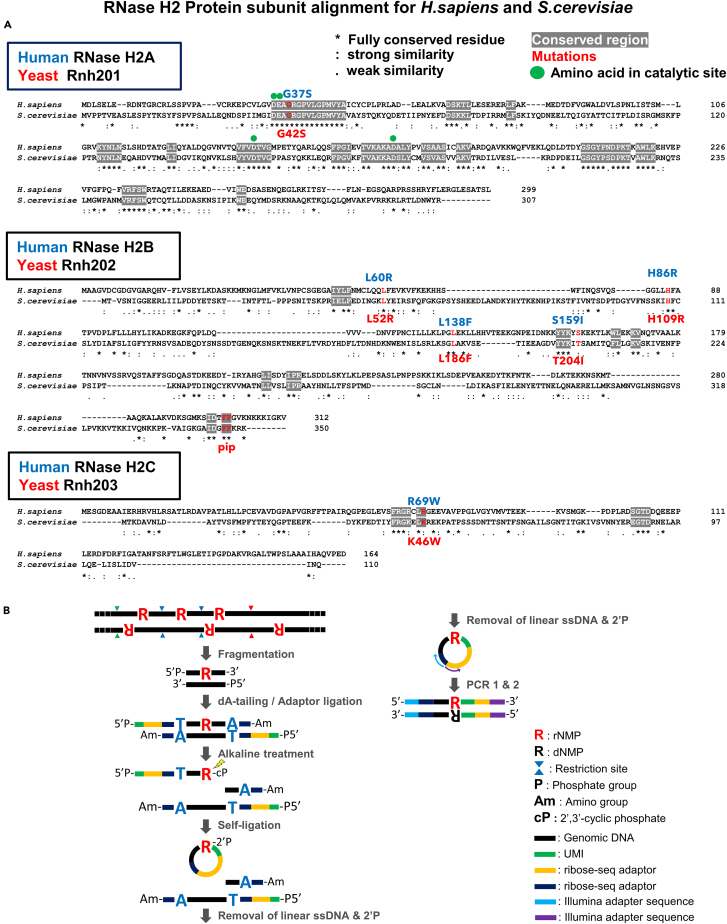
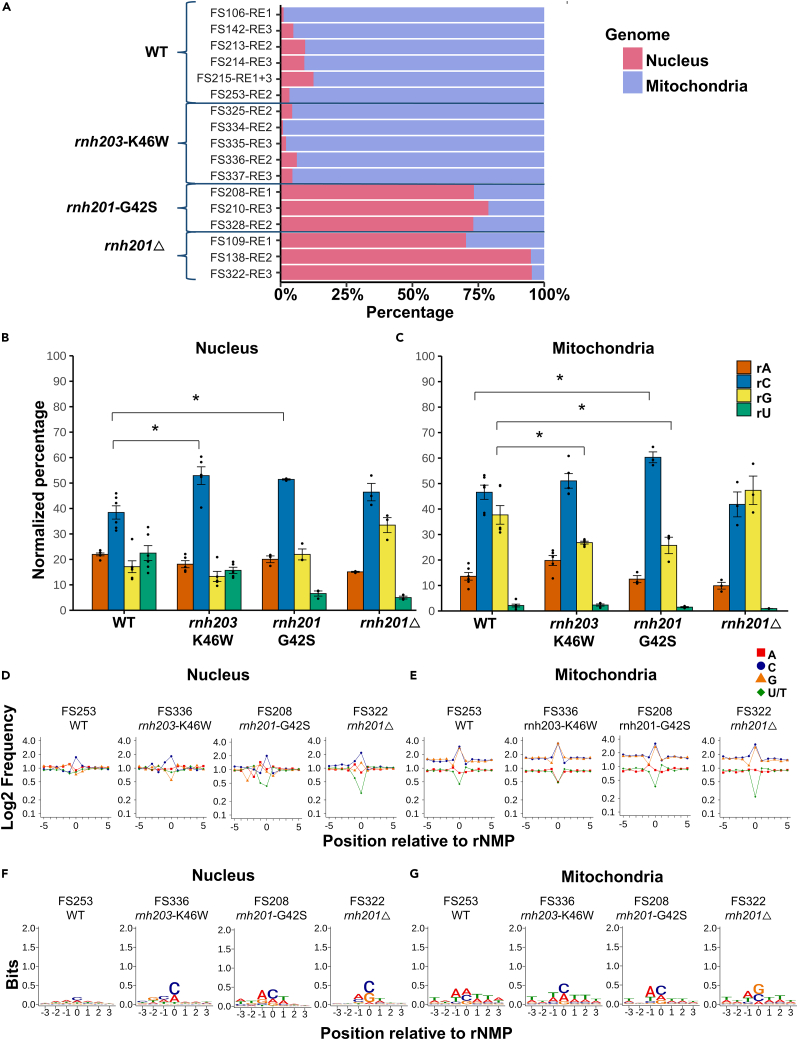
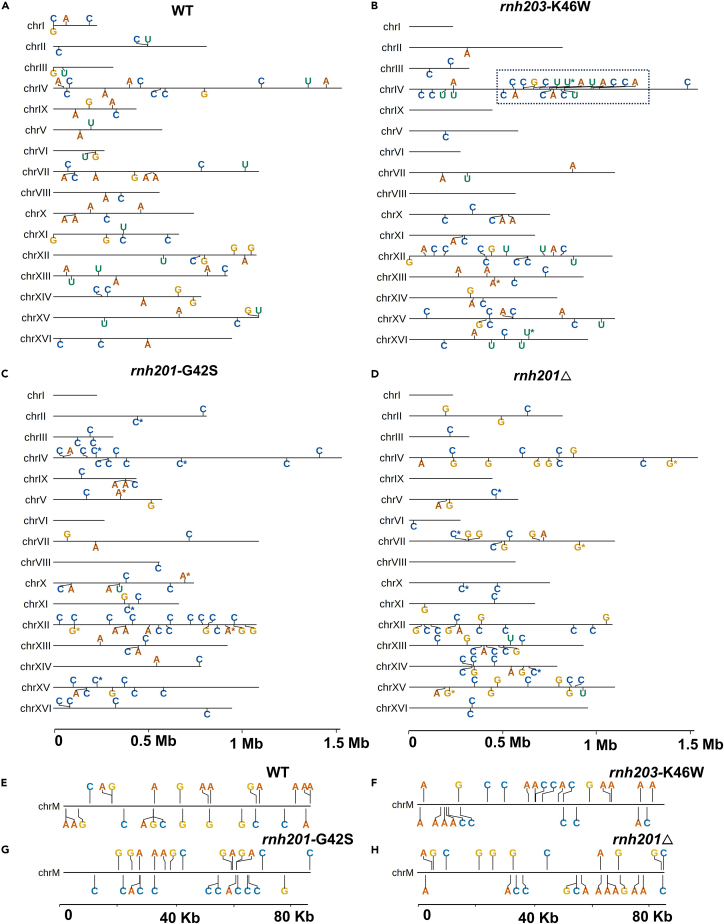
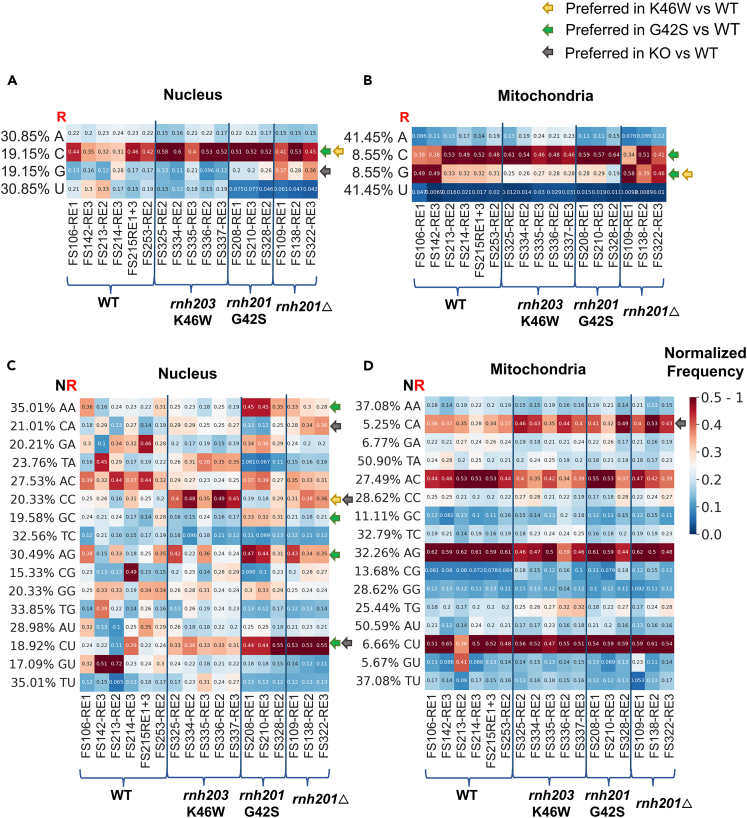
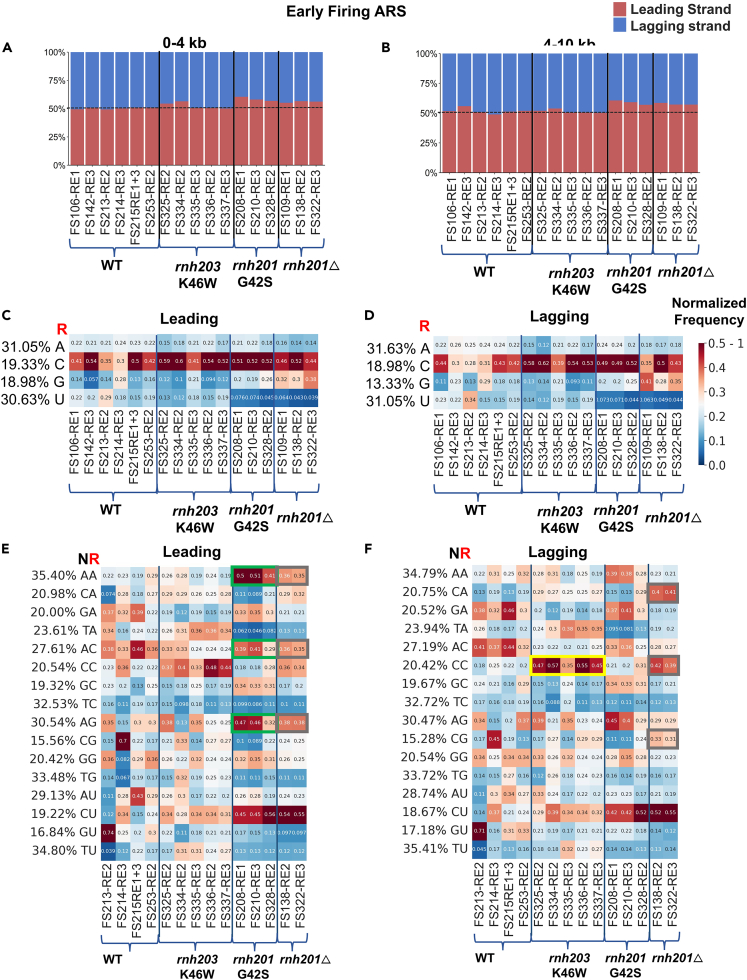
Ribonucleoside monophosphates (rNMPs) are abundantly found within genomic DNA of cells. The embedded rNMPs alter DNA properties and impact genome stability. Mutations in ribonuclease (RNase) H2, a key enzyme for rNMP removal, are associated with the Aicardi-Goutières syndrome (AGS), a severe neurological disorder. Here, we engineered orthologs of the human RNASEH2A-G37S and RNASEH2C-R69W AGS mutations in yeast Saccharomyces cerevisiae: rnh201-G42S and rnh203-K46W. Using the ribose-seq technique and the Ribose-Map bioinformatics toolkit, we unveiled rNMP abundance, composition, hotspots, and sequence context in these AGS-ortholog mutants. We found a high rNMP presence in the nuclear genome of rnh201-G42S-mutant cells, and an elevated rCMP content in both mutants, reflecting preferential cleavage of RNase H2 at rGMP. We discovered unique rNMP patterns in each mutant, showing differential activity of the AGS mutants on the leading or lagging replication strands. This study guides future research on rNMP characteristics in human genomes with AGS mutations.

Keywords: genomics; model organism; molecular genetics; nucleic acids.


Conflict of interest statement

We have a patent related to this study: Storici, F., Hesselberth, J.R., and Koh, K. D. Methods to detect Ribonucleotides in deoxyribonucleic acids. GTRC-6522, 2013; U.S. 10,787,703 B1 Sep. 29, 2020. https://uspto.report/patent/grant/10,787,703.

Figures

None
Graphical abstract
Figure 1
Figure 1
Schemes of human and yeast RNase H2 subunit amino acid sequence alignment with common AGS mutations and ribose-seq technique (A) Alignment of amino acid sequences of RNase H2 catalytic subunit H2A, and accessory subunits H2B and H2C from H. sapiens and S. cerevisiae. The gray highlights show the most conserved parts of the protein complex. Amino acids highlighted in red show AGS mutations in human RNase H2 subunits and the corresponding mutations in the S. cerevisiae ortholog enzyme subunits within fully conserved or similar amino acids. The amino acids with green circle on top represent those present in the catalytic site of the enzyme subunit A. The mutations characterized in this study found in the conserved regions of RNase H2 subunits are RNase H2A-G37S that corresponds to Rnh201-G42S in S. cerevisiae, and RNase H2C-R69W that corresponds to Rnh203-K46W in S. cerevisiae. (B) Schematic of the ribose-seq protocol. Genomic DNA is fragmented, dA-tailed, and ligated to a molecular barcode–containing sequencing adaptor. Alkali treatment denatures the DNA and cleaves at rNMP sites, exposing 2′,3′-cyclic phosphate and 2′-phosphate termini, which are recognized and ligated to the 5′-phosphate ends of the same molecules. Linear, unligated fragments are degraded using T5 exonuclease. Circular DNA molecules are PCR-amplified and sequenced at an Illumina platform.
Figure 2
Figure 2
rNMP-embedment rates and patterns in the nuclear and mitochondrial genome of S cerevisiae AGS-ortholog mutants (A) Horizontal stacked-bar plots showing rNMP-abundance rates as percentage of rNMPs found in the nuclear (red bars) and the mitochondrial (blue bars) genome of ribose-seq libraries (Table S1) of S. cerevisiae strain BY4742 with the indicated genotypes (wildtype, rnh203-K46W, rnh201-G42S, and rnh201Δ). (B) Bar graphs corresponding to the mean value and standard error of normalized percentages of rNMPs found in nuclear and mitochondrial genome. Statistical comparisons made using Mann-Whitney U test between AGS mutant and wild type libraries are shown by a bar aligned with the rNMP base and p value of <0.05 denoted by single asterisk (∗). (C) DNA of rNMP libraries for the indicated genotypes. The percentages are normalized to the base composition of the reference genome, such that the expected percentage for each rNMP base is 25%. Percentages without the normalization of rNMPs are shown in Figure S2 and are listed in Table S2. (D and E) (D) Sequence context +/− 5 nucleotides (nt) from the site of rNMP presence, which is indicated by the 0 position, for all rNMPs found in nuclear and (E) mitochondrial DNA, respectively. The frequency of each nucleotide is normalized to the frequency of the corresponding nucleotide present in the nuclear or mitochondrial reference genome. The plots shown are for one sample library of each genotype with the library and genotype indicated on top of the plots. The library name and genotype for the displayed data are indicated on top of each plot. Red square, A; blue circle, C; orange triangle, G; and green rhombus, U. The sequence plots generated from all rNMP libraries of this study are presented in Figures S3–S6. (F and G) (F) Sequence logo plots flanking +/− 3 nt from the rNMP position (0) of top 1 percentile locations with the highest rNMP counts observed in nuclear and (G) mitochondrial DNA. The y axis shows the level of sequence conservation, represented in bits. The library name and genotype for the displayed data are indicated on top of each plot. The Sequence logo plots for all the libraries are present in Figure S7.
Figure 3
Figure 3
Most abundant common hotspots in nuclear and mitochondrial DNA of the Rnh203-K46W and Rnh201-G42S AGS ortholog mutants Genome-mapped locations of the 75 most abundant common rNMP hotspots in nuclear DNA of ribose-seq libraries of (A) wild-type, (B) rnh203-K46W, (C) rnh201-G42S, and (D) rnh201Δ genotype. Genome mapped locations of the 25 most abundant common rNMP hotspots in mitochondrial DNA of ribose-seq libraries of (E) wildtype, (F) rnh203-K46W, (G) rnh201-G42S, and (H) rnh201Δ genotype. The represented annotations for rA, rC, rG, and rU are shown in red, blue, yellow, and green color letters, respectively. The common hotspots are selected based on occurrence in at least 2 libraries in each genotype and the highest rNMP Enrichment Factor (ratio of rNMP counts to average rNMP per base in genome). rNMP hotspots present in 80% or more libraries are marked with an asterisk (∗). Chromosome locations +/− 3 nt of flanking sequence, enrichment factor, mapped genes, and composition of common hotspots is provided in Table S4 for the common hotspots in the nuclear genome and in Table S5 for the common hotspots in the mitochondrial genome. Common hotspot clusters identified on Chr IV in rnh203-K46W libraries are indicated by a dashed frame. Sequence logo plots for top 75 (nucleus) and top 25 (mitochondria) with top 2 and 5 percentile hotspots of unique rNMP locations (both nucleus and mitochondria) in each genotype are shown in Figure S8.
Figure 4
Figure 4
rNMP-base composition and dinucleotide patterns identified in the rnh203-K46W and rnh201-G42S AGS ortholog mutant libraries Heatmap of normalized frequency of each type of rNMP (rA, rC, rG, and rU) in nuclear (A) and mitochondrial (B) DNA for all the ribose-seq libraries of this study. Heatmap analyses with normalized frequency of (C) nuclear and (D) mitochondrial NR dinucleotides (rA, rC, rG, and rU with the upstream deoxyribonucleotide with base A, C, G, or T) for all the ribose-seq libraries of this study. The formulas used to calculate these normalized frequencies are shown and explained in STAR Methods. Each column of the heatmap shows results of a specific ribose-seq library. Each library name is indicated underneath each column of the heatmap with its corresponding restriction enzyme (RE) set used. The ribose-seq libraries of the same genotype are also grouped together by brackets and separated by thick vertical blue lines. Each row shows results obtained for rNMP-mononucleotide or dinucleotide combination. The actual percentages of rNMP (rA, rC, rG, and rU) or dinucleotides of fixed base A, C, G, or T for the indicated base combinations (AA, CA, GA, and TA; AC, CC, GC, and TC; AG, CG, GG, and TG; and AT, CT, GT, and TT) present in the nuclear and mitochondrial genome of S. cerevisiae are shown to the left of the corresponding heatmaps. The observed % of rNMPs or dinucleotides with rNMPs with base A, C, G, or U were divided by the actual % of each rNMP or dinucleotide with fixed base A, C, G, or T in nuclear or mitochondrial DNA. The bar to the right shows how different frequency values are represented as different colors: white for 0.25; light red to red for 0.25 to 0.5–1, and dark blue to light blue for 0.25 to 0. Yellow, green, and gray arrows indicate the nucleotide frequency significantly preferred for rnh203-K46W, rnh201-G42S, and rnh201Δ mutant libraries, respectively, in comparison to wild-type libraries. Significantly different frequencies with p value of <0.05 are highlighted based on one tailed Mann Whitney-Wilcoxon U test between nucleotide frequencies in the AGS mutant genotypes vs. the expected value of 0.25 (Tables S6 and S7), as well as two tailed Mann-Whitney Wilcoxon U test AGS-mutant libraries vs. wild-type libraries (Tables S8 and S9). Dinucleotide heatmaps for the most frequent dNMP found downstream of the rNMPs in the nuclear and mitochondrial DNA are presented in Figure S9.
Figure 5
Figure 5
The rnh203-K46W and rnh201-G42S AGS ortholog mutant libraries display bias distribution, composition, and NR-dinucleotide patterns on the leading and lagging strand in yeast nuclear DNA Stacked-percentage bar plots of rNMP counts in (A) 0–4,000 nt and (B) 4,000–10,000 nt windows on the leading (red bars) and lagging (blue bars) strand regions adjacent to early firing ARSs. Mono nucleotide heatmaps analysis in 4,000–10,000 nt windows in the leading (C) and lagging (D) strands with frequencies normalized to the dNMP content in the 4000–10,000-nt window around the early-firing ARSs on the leading or lagging strand, respectively. Dinucleotide NR (rA, rC, rG, and rU with the upstream deoxyribonucleotide with base A, C, G, or T) heatmap analysis to reveal preferences on the (E) leading and (F) lagging strand for wild-type, rnh201Δ, and AGS mutant libraries 4,000–10,000 nt from the early-firing ARSs. The formulas used to calculate these normalized frequencies are shown and explained in the STAR Methods. Each column of the heatmap shows results of a specific ribose-seq library. Libraries with more than 400 rNMPs in the leading and lagging strand are displayed in the heatmaps. Each library name is indicated underneath each column of the heatmap with its corresponding restriction enzyme (RE) set used. The ribose-seq libraries of the same genotype are also grouped together by brackets and separated by thick vertical blue lines. Each row shows results obtained for rNMP or dinucleotide combination. The actual percentages of rNMP (rA, rC, rG, and rU) dinucleotides of fixed base A, C, G, or T for the indicated base combinations (AA, CA, GA, and TA; AC, CC, GC, and TC; AG, CG, GG, and TG; and AT, CT, GT, and TT) present in the 4,000–10,000-nt windows around early-firing ARSs on the leading and lagging strands are shown to the left of the heatmaps. The observed % of rNMPs and dinucleotides with rNMPs with base A, C, G, or U were divided by the actual % of each rNMP and dinucleotide with fixed base A, C, G, or T in 4,000–10,000-nt windows around ARSs on the leading and lagging strands. The bar to the right shows how different frequency values are represented as different colors: white for 0.25; light red to red for 0.25 to 0.5–1, and dark blue to light blue for 0.25 to 0. Yellow, green, and gray boxes indicate dinucleotide preferences found in the lagging and leading strands for rnh203-K46W, rnh201-G42S, and rnh201Δ mutant libraries.

Update of

Similar articles

Cited by

References

    1. Fazzi E., Cattalini M., Orcesi S., Tincani A., Andreoli L., Balottin U., De Simone M., Fredi M., Facchetti F., Galli J., et al. Aicardi–Goutieres syndrome, a rare neurological disease in children: A new autoimmune disorder? Autoimmun. Rev. 2013;12:506–509. doi: 10.1016/J.AUTREV.2012.08.012. - DOI - PubMed
    1. Al Mutairi F., Alfadhel M., Nashabat M., El-Hattab A.W., Ben-Omran T., Hertecant J., Eyaid W., Ali R., Alasmari A., Kara M., et al. Phenotypic and Molecular Spectrum of Aicardi-Goutières Syndrome: A Study of 24 Patients. Pediatr. Neurol. 2018;78:35–40. doi: 10.1016/J.PEDIATRNEUROL.2017.09.002. - DOI - PubMed
    1. Crow Y.J., Massey R.F., Innes J.R., Pairaudeau P.W., Rowland Hill C.A., Woods C.G., Ali M., Livingston J.H., Lebon P., Nischall K., et al. Congenital glaucoma and brain stem atrophy as features of Aicardi–Goutières syndrome. Am. J. Med. Genet. 2004;129A:303–307. doi: 10.1002/AJMG.A.30250. - DOI - PubMed
    1. Williams J.S., Lujan S.A., Kunkel T.A. Processing ribonucleotides incorporated during eukaryotic DNA replication. Nat. Rev. Mol. Cell Biol. 2016;17:350–363. doi: 10.1038/NRM.2016.37. - DOI - PMC - PubMed
    1. Łazowski K., Faraz M., Vaisman A., Ashton N.W., Jonczyk P., Fijalkowska I.J., Clausen A.R., Woodgate R., Makiela-Dzbenska K. Strand specificity of ribonucleotide excision repair in Escherichia coli. Nucleic Acids Res. 2023;51:1766–1782. doi: 10.1093/NAR/GKAD038. - DOI - PMC - PubMed