. 2024 May 17;27(6):110013.
doi: 10.1016/j.isci.2024.110013. eCollection 2024 Jun 21.

Machine-learning-based integrative -'omics analyses reveal immunologic and metabolic dysregulation in environmental enteric dysfunction

Affiliations

Machine-learning-based integrative -'omics analyses reveal immunologic and metabolic dysregulation in environmental enteric dysfunction

Fatima Zulqarnain et al. iScience. .

Abstract

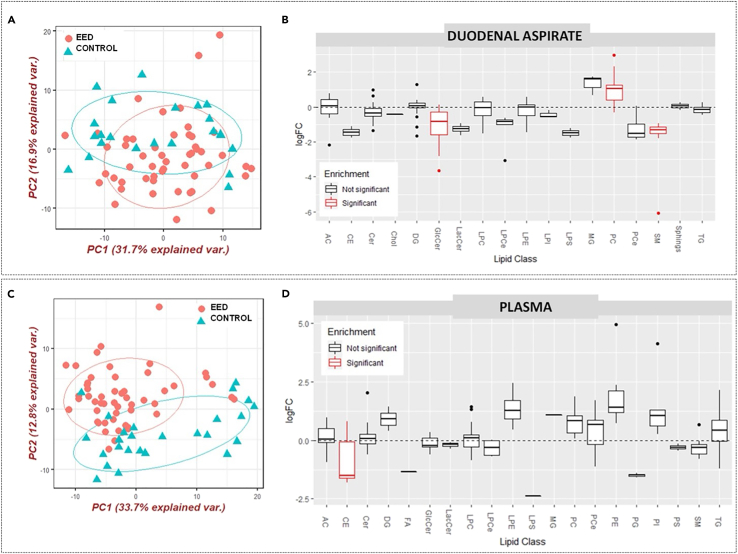
Environmental enteric dysfunction (EED) is a subclinical enteropathy challenging to diagnose due to an overlap of tissue features with other inflammatory enteropathies. EED subjects (n = 52) from Pakistan, controls (n = 25), and a validation EED cohort (n = 30) from Zambia were used to develop a machine-learning-based image analysis classification model. We extracted histologic feature representations from the Pakistan EED model and correlated them to transcriptomics and clinical biomarkers. In-silico metabolic network modeling was used to characterize alterations in metabolic flux between EED and controls and validated using untargeted lipidomics. Genes encoding beta-ureidopropionase, CYP4F3, and epoxide hydrolase 1 correlated to numerous tissue feature representations. Fatty acid and glycerophospholipid metabolism-related reactions showed altered flux. Increased phosphatidylcholine, lysophosphatidylcholine (LPC), and ether-linked LPCs, and decreased ester-linked LPCs were observed in the duodenal lipidome of Pakistan EED subjects, while plasma levels of glycine-conjugated bile acids were significantly increased. Together, these findings elucidate a multi-omic signature of EED.

Keywords: Gastroenterology; Lipidomics; Machine learning; Medical imaging; Metabolic flux analysis; Transcriptomics.


Conflict of interest statement

KDRS has equity in Asklepion Pharmaceuticals and is a consultant to Travere Therapeutics and Mirum Pharmaceuticals. All the other authors have no conflicts of interest to disclose.

Figures

None
Graphical abstract
Figure 1
Figure 1
Overview of genotype-phenotype analyses (A) Duodenal tissue biopsies from subjects in Pakistan with EED (n = 52) and controls (n = 25) were stained with hematoxylin and eosin and digitized as WSIs (n = 168 and 56, respectively). WSIs were cropped into patches of 512x512 pixels. Patches were augmented through rotation and stain normalization techniques to ensure these patches were well-distributed on a color histogram spectrum and had multiple morphological patterns. Parallelly, an EED-specific immunohistochemistry panel was applied on unstained duodenal biopsy sections from a subset of the Pakistan cohort (n = 21) and USA control (n = 20). (B) Patches were input into a ResNet18, a convolutional neural network, to create a classification model. Discriminatory tissue features from the classification model were represented as mathematic vectors. A trained pathologist visualized discriminatory features using GradCAMs to validate the GradCAM-defined features of EED. (C) Histologic features of interest were represented numerically and correlated with transcriptomic data, clinical biomarkers, fecal microbiota (as measured by stool TAC), and histology scores via previously established metrics. Genes of interest underwent functional enrichment analysis as well as comparisons to metabolic network modeling and lipidomic pathway analysis for congruence. (D) Duodenal biopsy WSIs (n = 60) from n = 30 subjects with EED from Zambia were input into the pre-trained model from Figure 2B to validate model performance. Transcriptomic data from the Zambia cohort was correlated with machine learning-derived feature representations, and the overlap between the datasets from Pakistan and Zambia was analyzed. EED = environmental enteric dysfunction; GradCAMs = Gradient-weighted Class Activation Mappings; H&E: hematoxylin and eosin; IHC = immunohistochemistry; TAC = Taqman Array Card; WSI = whole slide images.
Figure 2
Figure 2
Machine-learning-based classification of EED versus controls validated using immunohistochemistry (A) Patch-level confusion matrix showing the classification of controls versus patients with EED from the Pakistan cohort. The model classified controls correctly in 99% of the images and EED in 97% of the images. (B) Gradient-weighted Class Activation Mapping (GradCAM) review of Pakistan EED images revealed that goblet cells, intraepithelial lymphocytes, and crowded surface epithelium were features of interest in our model. (C) Immunohistochemical staining of the duodenal section using anti-defensin-alpha 5, anti-CD3, anti-cytokeratin, anti-CD 19, anti-sucrase isomaltase, and anti-mucin 2. The scale bar = 800 μm in the non-magnified image and 80 μm in the magnified inlay. (D–M) Box and whisker plots showing median, upper and lower quartiles, and minimum and maximum values. Immunohistochemistry of biopsy slides from patients with EED showed increased intraepithelial lymphocytes, with B-lymphocytes significantly different across the whole tissue surface area, and T-lymphocytes were significantly different in the epithelium. Further, increased Paneth cell area and increased goblet cell area were observable in patients with EED versus controls. ns = not significant, asterixis denote significance: ∗p ≤ 0.05, ∗∗p ≤ 0.05, ∗∗∗p ≤ 0.005. EED = environmental enteric dysfunction.
Figure 3
Figure 3
Genotype-phenotype relationship analysis of the Pakistan cohort (A) Machine learning-derived discriminatory tissue feature representations from the classification model were correlated with genomics data using the Pearson correlation coefficient. 78 gene groups most heavily correlated with tissue features (r > 0.7) were analyzed using functional enrichment analysis using ToppGene. Gene groups involved in oxidation and reduction, lyases, vitamin binding genes, transition metal ion binding genes, and genes involved in transmembrane transport were found to correlate strongly with biopsy features. (B) Genes encoding beta-ureidopropionase (UPB1, epoxide hydrolase 1 (EPHX1), and cytochrome p450 4F3 (CYP4F3) were correlated with the highest number of features. p < 0.05 was considered statistically significant. ML = machine learning; FDR = false discovery rate using the Benjamini-Hochberg method r = Pearson’s correlation coefficient; WSI = whole slide image.
Figure 4
Figure 4
Overview of contextualized metabolic network modeling methods and untargeted mass spectrometry-based metabolomics (A) RNA transcriptomic data from the duodenal biopsies of children with EED from Pakistan and Zambia and controls from the USA were overlaid onto Recon3D, a large, publicly available human metabolic network reconstruction, which contains detailed information on human genes, the proteins they encode, and the metabolic reactions they catalyze. Reactions present in either the transcriptomic datasets from EED or the controls underwent RIPTIDe, a subtype of flux balance analysis. (B) A random forest classifier was used to classify between EED and controls by identifying reactions that were more predictive of either state to generate a list of reactions with altered flux in EED and controls. These reactions were then grouped into their broad biochemical families. (C) Liquid chromatography with high resolution mass spectrometry analysis was performed on both plasma and duodenal aspirate to reveal alterations in lipidome between patients with EED and controls. EED = environmental enteric dysfunction; RIPTIDe = Reaction Inclusion by Parsimony and Transcript Distribution.
Figure 5
Figure 5
Reactions with altered flux in EED versus controls from the USA Box and whisker plots showing median, upper, and lower quartiles, and minimum and maximum values. Our Flux Balance Analysis/Random Forest framework was applied to RNA sequencing data from the Pakistan EED cohort (A-J) or Zambia EED cohort (K-T) and compared to controls from the USA. The most altered metabolic reactions between the EED and control groups were categorized into "families" based on the broad biochemical processes they catalyze. In all graphs, the x axis describes the altered reaction between the controls (white) and EED states (gray). The y axis shows the flux values generated by RIPTiDe after analyzing the flow of metabolites through a duodenal-specific metabolic network reconstruction. The scale of flux values (y axis) varies with the reactions as the efficiency of different metabolic pathways in generating biomass varies in a given biological system. A Mann-Whitney U test was used to compare reactions that varied between patients with EED and controls. The scale of flux values (y axis) varies with the reactions as the efficiency of different metabolic pathways in generating biomass varies in each biological system. ∗∗∗∗p < 0.0001. EED = environmental enteric dysfunction.
Figure 6
Figure 6
Untargeted lipidomics analyses of EED cohort from Pakistan and controls from the USA (A and B) Lipidomic analysis of duodenal aspirate. (C and D) Lipidomic analysis of plasma. (A and C) Principal component analysis of EED versus control groups from the duodenal aspirate and plasma, respectively. Ion features from positive ES mode were used in the analysis. Explained variance is a statistical measure of the amount of variation in a dataset that can be ascribed to each of the principal components obtained by the principal component analysis technique. (B) Lipid set enrichment analysis (LSEA) showed sphingomyelin and glucosylceramide classes significantly downregulated and phosphatidylcholines were upregulated in the duodenal aspirate. (D) LSEA showed cholesterol esters were significantly down-regulated in the plasma. After lipids are ranked by their fold changes, enrichment scores, and significance are calculated for each lipid set using an efficient permutation algorithm85. The x axis shows the lipid classes (detailed nomenclature found in Tables S4–S9). The y axis shows the logarithmic transformation of the fold change (logFC). PC = principal component; EED = environmental enteric dysfunction.

References

    1. Keusch G.T., Denno D.M., Black R.E., Duggan C., Guerrant R.L., Lavery J.V., Nataro J.P., Rosenberg I.H., Ryan E.T., Tarr P.I., et al. Environmental enteric dysfunction: pathogenesis, diagnosis, and clinical consequences. Clin. Infect. Dis. 2014;59:S207–S212. doi: 10.1093/cid/ciu485. - DOI - PMC - PubMed
    1. Berkman D.S., Lescano A.G., Gilman R.H., Lopez S.L., Black M.M. Effects of stunting, diarrhoeal disease, and parasitic infection during infancy on cognition in late childhood: a follow-up study. Lancet. 2002;359:564–571. doi: 10.1016/s0140-6736(02)07744-9. - DOI - PubMed
    1. Mondal D., Minak J., Alam M., Liu Y., Dai J., Korpe P., Liu L., Haque R., Petri W.A., Jr. Contribution of enteric infection, altered intestinal barrier function, and maternal malnutrition to infant malnutrition in Bangladesh. Clin. Infect. Dis. 2012;54:185–192. doi: 10.1093/cid/cir807. - DOI - PMC - PubMed
    1. Lunn P.G., Northrop-Clewes C.A., Downes R.M. Intestinal permeability, mucosal injury, and growth faltering in Gambian infants. Lancet. 1991;338:907–910. doi: 10.1016/0140-6736(91)91772-M. - DOI - PubMed
    1. George C.M., Burrowes V., Perin J., Oldja L., Biswas S., Sack D., Ahmed S., Haque R., Bhuiyan N.A., Parvin T., et al. Enteric Infections in Young Children are Associated with Environmental Enteropathy and Impaired Growth. Trop. Med. Int. Health. 2018;23:26–33. doi: 10.1111/tmi.13002. - DOI - PubMed