. 2024 May 16;27(6):109981.
doi: 10.1016/j.isci.2024.109981. eCollection 2024 Jun 21.

Antibody signatures against viruses and microbiome reflect past and chronic exposures and associate with aging and inflammation

Affiliations

Antibody signatures against viruses and microbiome reflect past and chronic exposures and associate with aging and inflammation

Sergio Andreu-Sánchez et al. iScience. .

Abstract

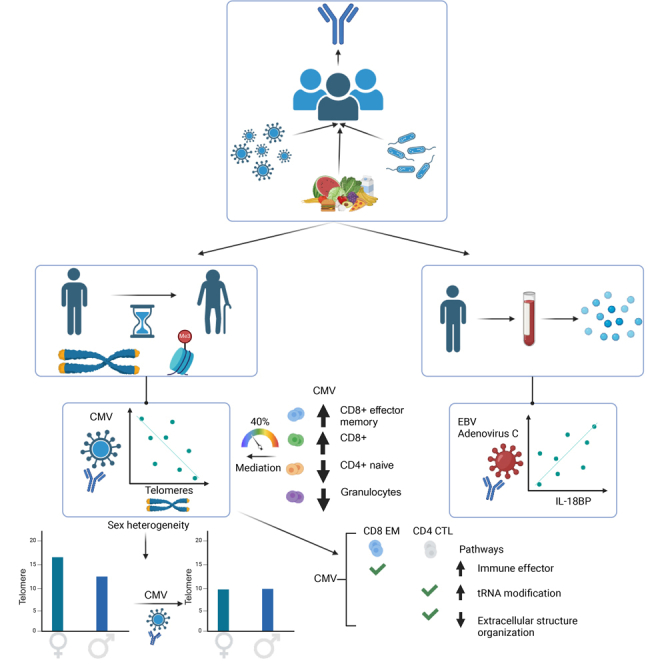
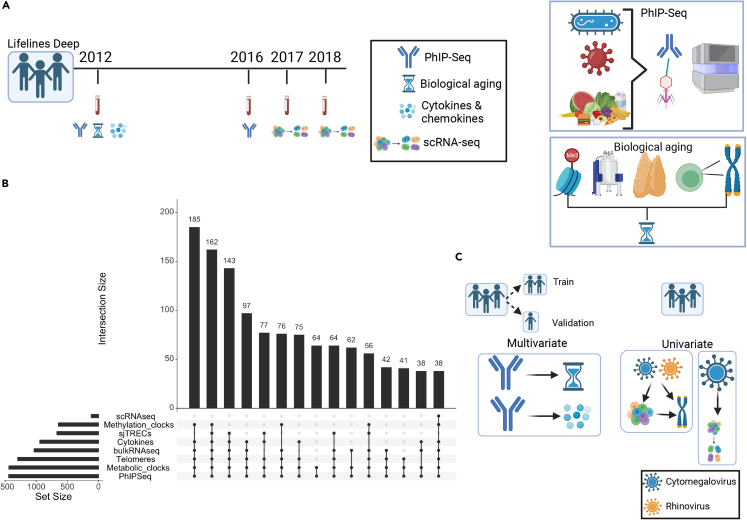
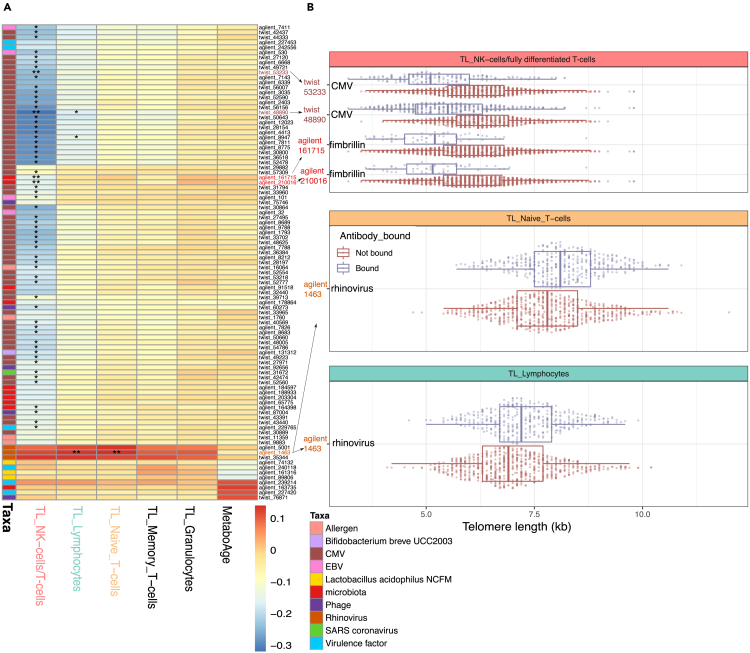
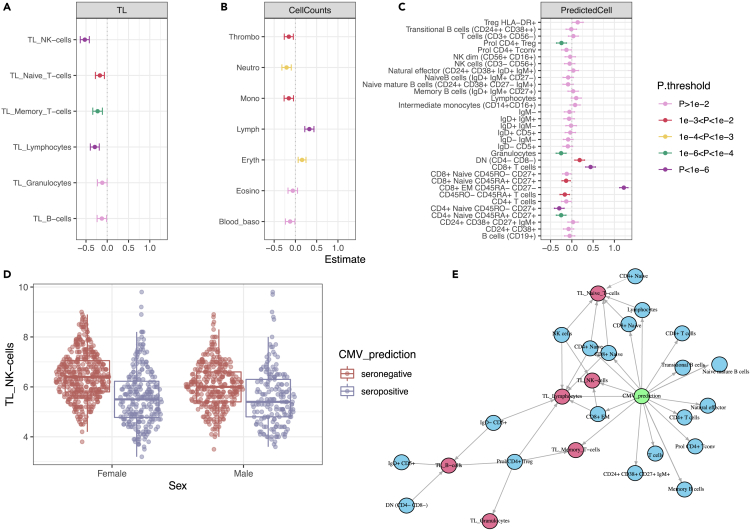
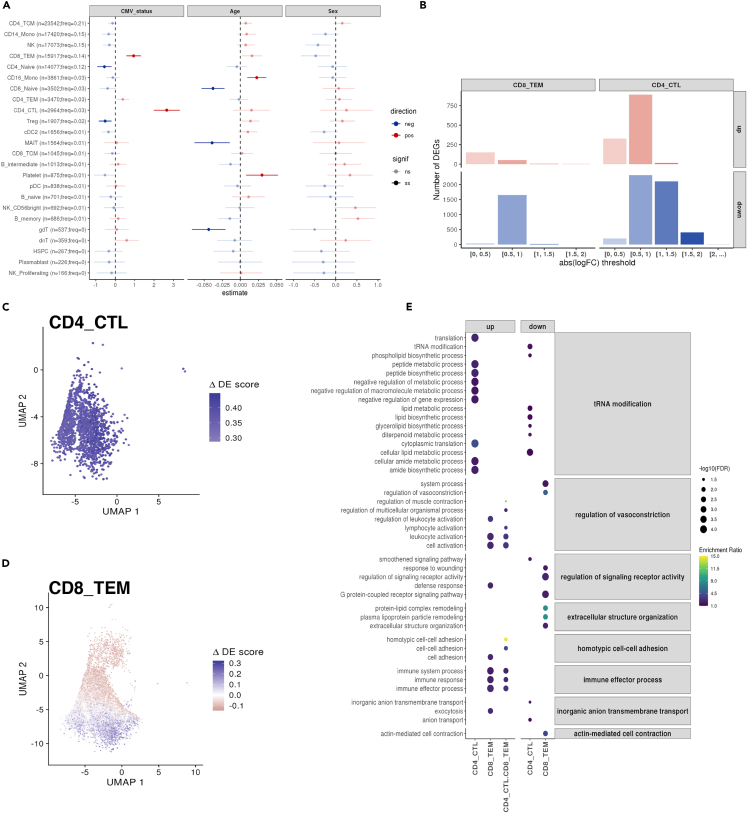
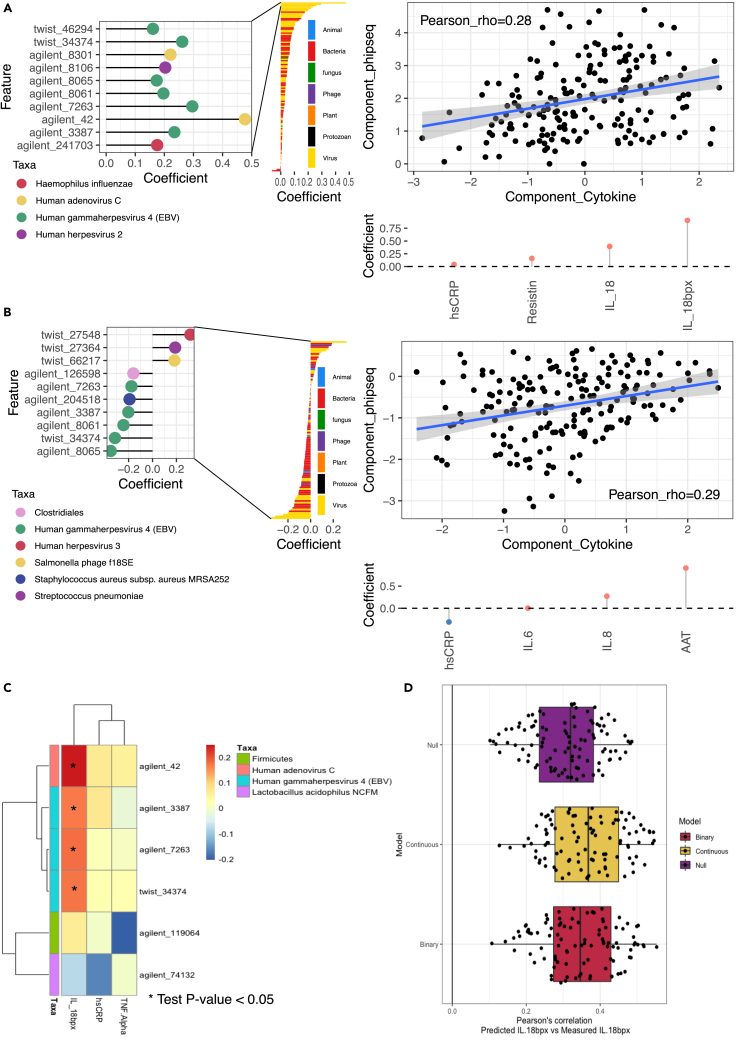
Encounters with pathogens and other molecules can imprint long-lasting effects on our immune system, influencing future physiological outcomes. Given the wide range of microbes to which humans are exposed, their collective impact on health is not fully understood. To explore relations between exposures and biological aging and inflammation, we profiled an antibody-binding repertoire against 2,815 microbial, viral, and environmental peptides in a population cohort of 1,443 participants. Utilizing antibody-binding as a proxy for past exposures, we investigated their impact on biological aging, cell composition, and inflammation. Immune response against cytomegalovirus (CMV), rhinovirus, and gut bacteria relates with telomere length. Single-cell expression measurements identified an effect of CMV infection on the transcriptional landscape of subpopulations of CD8 and CD4 T-cells. This examination of the relationship between microbial exposures and biological aging and inflammation highlights a role for chronic infections (CMV and Epstein-Barr virus) and common pathogens (rhinoviruses and adenovirus C).

Keywords: Genomics; Immunology; Proteomics.


Conflict of interest statement

P.L. is a founding shareholder in Repeat Diagnostics, a CLIA certified company specializing in leukocyte telomere length measurements using Flow-FISH, where G.A. is also employed. The other authors declare no competing interests.

Figures

None
Graphical abstract
Figure 1
Figure 1
Data and methodological framework (A) Data from 1,443 participants of the Dutch cohort Lifelines-DEEP were used to explore the relationship of past and chronic exposures, inflammation and aging. PhIP-Seq was used to profile immune responses against 2,815 peptides. Fourteen circulating cytokines were available for 939 participants for whom we had PhIP-Seq data. Telomere lengths from six blood cell types (n = 1,243), biological aging clocks (methylation clock (n = 641), metabolomic clock (n = 1,437)) and sj-TRECS (n = 633) were used to investigate aging. Bulk blood (n = 1,173) and peripheral blood mononuclear cell (PBMC) single-cell gene expression (n = 119) were also obtained. (B) Upset plot of common data subsets showing the number of samples with overlapping data layers. (C) Analysis framework. Participants were split into a training and replication set. Univariate and multivariate techniques were applied to relate exposures (PhIP-Seq) to the other omics-derived aging and immunological biomarkers. Using the whole population, we explored the relationship of cytomegalovirus and rhinoviruses with cell counts and telomere length. Cytomegalovirus, in particular, was related to single-cell gene expression changes measured in samples obtained 1–6 years after collection of blood for PhIP-Seq measurements.
Figure 2
Figure 2
Associations between antibody-bound peptides and aging biomarkers (A) Heatmap showing correlation coefficients in the training dataset. Each row represents a peptide (colored according to taxonomic origin). Each column represents the telomere length (TL) of an immune cell type. ∗ indicates significance (p < 0.05) in both the testing and training datasets when controlling for age and sex using partial correlation. ∗∗ indicates significance (p < 0.05) in both the training and validation datasets with additional control for CMV prediction (see text). (B) Boxplots display the associations that remained significant in both the training and validation datasets after accounting for CMV serostatus. X axis displays TL measurements determined using Flow-FISH for different cell populations. Y axis indicates the peptides where the association was found. Color indicates whether the PhIP-Seq results predicted antibody-binding against the peptide.
Figure 3
Figure 3
Associations of CMV prediction with cell counts and telomere length (A–C), Linear association of CMV prediction (binary) with (A) telomere length (TL), (B) measured blood cell types, and (C) RNA-seq deconvoluted predicted cell counts. Estimated effect values, accounting for age and sex, are displayed. Error bars represent the 95% confidence interval of the estimated effect. (D) TL differences between men and women in the NK-cell/fully differentiated T cell population. CMV interacts significantly with sex. (E) Mediation network. The CMV infection effect (green circle) on TL (red circles) is partially mediated by changes in predicted cell counts (blue circles). Effects are estimated using lasso regression. Edges represent absolute effect sizes above 0.01.
Figure 4
Figure 4
CMV seropositivity associates with both cell composition and cell-type-specific gene expression changes (A) Forest plot showing the linear association of CMV serostatus, age, and sex with high-level (Azimuth’s l2) cell-type proportions from the Oelen2022 scRNA-seq data. Estimated effect values, accounting for both biological (sex and age) and technical (10X Chromium Single Cell 3′ chemistry and experimental batch) covariates, are displayed. Error bars represent the 95% confidence interval of the estimated effect. The absolute number and relative frequency of each cell type is shown. (B) Bar plot of the number of CMV-differentially expressed genes (DEGs) across cell types, split by the direction (up- or down-regulated) and magnitude of the effect size (x axis). (C–D) UMAPs showing the ΔDE (differential expression) scores using data from CD4+ CTL (C) and CD8+ TEM (D). (E) Enriched gene ontology (GO) terms, using the biological process pathway database, from three different CMV-DEG sets using the Oelen2022 data: CD4+ CTL- DEGs, CD8+ TEM- DEGs, and DEGs shared between CD4+ CTL and CD8+ TEM. GO terms are grouped based on their semantic similarity to simplify the redundancy of GO sets. Dot color indicates enrichment ratio. Dot size indicates statistical significance.
Figure 5
Figure 5
Circulating cytokines and antibody epitope reactivity (A and B) Sparse-CCA components 1 (A) and 4 (B), which associate a component loaded by presence/absence PhIP-Seq profiles (Y axis) and circulating cytokine concentrations (X axis). Right panel shows the correlation between PhIP-Seq and cytokine component in test data. Left panel shows top antibody-bound peptide loads in the PhIP-Seq component (Y axis in right panel). Bottom panel shows the top cytokine component loads in the cytokine component (X axis in right panel). (C) HAllA heatmap of associations. X axis shows the cytokines that had at least one significant association in the training data. Color indicates the Spearman’s correlation in the training data. ∗ indicates a partial Spearman’s correlation P-value <0.05 in the validation data. Y axis displays the different peptides with annotation indicating the organism where the peptide originates. (D) Prediction results for IL-18BP using an L2-regularized linear model with all peptides, using presence-absence scores (binary), normalized read counts (continuous), or prediction using ordinary least squares of age and sex. Each dot represents the Pearson’s correlation of the held-out validation data’s prediction and measurement. Estimations include rho values for 10-fold cross-validation repeated 10 times.

References

    1. Kotas M.E., Medzhitov R. Homeostasis, inflammation, and disease susceptibility. Cell. 2015;160:816–827. - PMC - PubMed
    1. Pyrkov T.V., Avchaciov K., Tarkhov A.E., Menshikov L.I., Gudkov A.V., Fedichev P.O. Longitudinal analysis of blood markers reveals progressive loss of resilience and predicts human lifespan limit. Nat. Commun. 2021;12:2765. - PMC - PubMed
    1. Nikolich-Žugich J. The twilight of immunity: emerging concepts in aging of the immune system. Nat. Immunol. 2018;19:10–19. - PubMed
    1. Aiello A., Farzaneh F., Candore G., Caruso C., Davinelli S., Gambino C.M., Ligotti M.E., Zareian N., Accardi G. Immunosenescence and Its Hallmarks: How to Oppose Aging Strategically? A Review of Potential Options for Therapeutic Intervention. Front. Immunol. 2019;10:2247. - PMC - PubMed
    1. Kondilis-Mangum H.D., Wade P.A. Epigenetics and the Adaptive Immune Response. Mol. Aspect. Med. 2013;34:813–825. doi: 10.1016/J.MAM.2012.06.008. - DOI - PMC - PubMed