. 2024 May 16;27(6):110006.
doi: 10.1016/j.isci.2024.110006. eCollection 2024 Jun 21.

Microglial apolipoprotein E particles contribute to neuronal senescence and synaptotoxicity

Affiliations

Microglial apolipoprotein E particles contribute to neuronal senescence and synaptotoxicity

Na Wang et al. iScience. .

Abstract

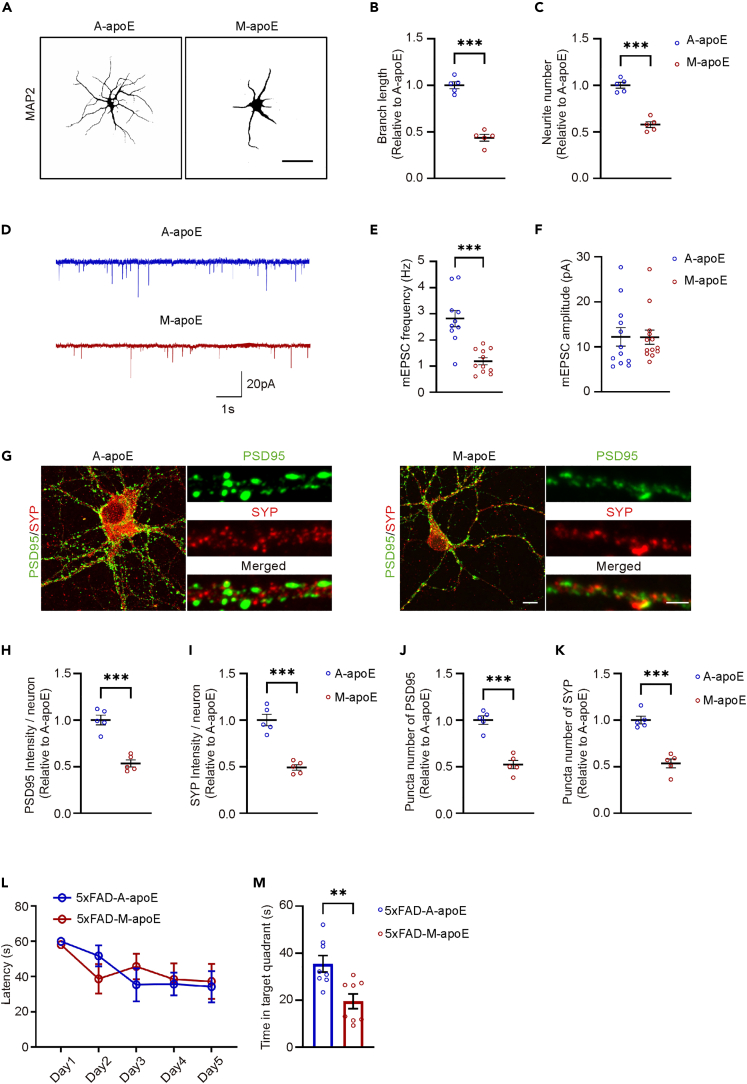
Apolipoprotein E (apoE) plays a crucial role in the pathogenesis of Alzheimer's disease (AD). Microglia exhibit a substantial upregulation of apoE in AD-associated circumstances, despite astrocytes being the primary source of apoE expression and secretion in the brain. Although the role of astrocytic apoE in the brain has been extensively investigated, it remains unclear that whether and how apoE particles generated from astrocytes and microglia differ in biological characteristic and function. Here, we demonstrate the differences in size between apoE particles generated from microglia and astrocytes. Microglial apoE particles impair neurite growth and synapses, and promote neuronal senescence, whereas depletion of GPNMB (glycoprotein non-metastatic melanoma protein B) in microglial apoE particles mitigated these deleterious effects. In addition, human APOE4-expressing microglia are more neurotoxic than APOE3-bearing microglia. For the first time, these results offer concrete evidence that apoE particles produced by microglia are involved in neuronal senescence and toxicity.

Keywords: Biological sciences; Cellular neuroscience; Neuroscience; Transcriptomics.


Conflict of interest statement

The authors declare no competing interests.

Figures

None
Graphical abstract
Figure 1
Figure 1
Characterization of apoE particles (A) Schematic illustration of apoE particle purification by apoE antibody column. (B) Schematic illustration of apoE particle analysis by size exclusion chromatography (SEC). (C) ApoE particle ratios in different elution fractions were determined by ELISA. (D) ApoE particle sizes were analyzed by dynamic light scattering (DLS). (E) Representative images of astrocytic apoE particles (A-ApoE) and microglial apoE particles (M-ApoE) visualized with a transmission electron microscopy. Scale bar, 50 nm. (F) Quantification of size of apoE particles/group. At least 50 apoE particles were used for the analysis. Data are presented as mean ± SEM. Statistical significance was determined with unpaired Student’s t test. ∗∗∗, p < 0.001.
Figure 2
Figure 2
Microglial apoE particles are neurotoxic (A) Sketched images of cultured neuron treated with astrocytic apoE particles and microglial apoE particles. Scale bar, 50 μm. (B and C) Quantification of branch lengths and neurite numbers of cultured neurons (n = 5). The relative branch length and neurite number of neurons treated with microglial apoE particles were normalized to that of neurons treated with astrocytic apoE particles. (D) Example of miniature EPSC traces recorded on cultured neurons treated with astrocytic apoE particles and microglial apoE particles. Scale bar, 1 s, 2 pA. (E and F) Quantification of mEPSC frequency and amplitude. At least 10 neurons were recorded for the analysis. (G) Representative confocal images of PSD-95 (green) and synaptophysin (red) of cultured neurons treated with astrocytic apoE particles and microglial apoE particles. Enlarged synapses are shown on the right. Scale bar, 10 μm. (H–K) Quantification of PSD-95 and synaptophysin fluorescence intensity and puncta number per neuron (n = 5). Relative fluorescence intensity and puncta number from the microglial apoE particle treated group were normalized to that of the astrocytic apoE particles treated group. (L) Performance of 5xFAD mice injected with astrocytic apoE particles (5xFAD-A-apoE) or microglial apoE particles (5xFAD-M-apoE) in the training phase of the MWM, n = 8 mice/group. (M) Time that treated 5xFAD mice spent in target quadrant in the Probe test of MWM. Data are presented as mean ± SEM. Statistical significance was determined with unpaired Student’s t test. For cellular experiments, n represents the number of independent experiments. ∗∗, p < 0.01, ∗∗∗, p < 0.001.
Figure 3
Figure 3
Microglial apoE particles promote neuronal senescence (A) Volcano plot showing differentially expressed genes (DEGs) in cultured neurons treated with astrocytic apoE particles and microglial apoE particles, as measured by RNA-seq. The X axis specifies the log2 fold change (FC), and the Y axis represents the negative log10 of the p.adj values. Red and blue dots represent genes of which the expression levels are significantly increased or decreased in M-apoE versus A-apoE (filtering criteria: log2 FC > 0.5 and p value <0.05). (B) Bubble chart showing the top 20 enriched KEGG pathway in M-apoE versus A-apoE. Dot sizes correspond to gene count number. Dots colored by p value. Rich factors indicate the percentage of significantly increased genes in whole pathway. (C) Heatmap showing changes in gene expression of cellular senescence pathway. Z-scores normalization is used for the analysis. Red and blue squares represent genes whose expression level is significantly increased or decreased in M-apoE versus A-apoE (filtering criteria: log2 FC > 1 and p value <0.05). (D and E) Real-time quantitative PCR (real-time qPCR) analysis of gene expression of cellular senescence pathways, normalized to a housekeeping gene (GAPDH). Data represent fold change relative to A-apoE and means ± SEM of three independent experiments. (F and H) Representative confocal images of γH2AX (F) and H3K27me3 (H) staining of cultured neuron treated with astrocytic or microglial apoE particles. Scale bar, 10 μm. (G and I) Quantification of γH2AX (G) and H3K27me3 (I) fluorescence intensity per cell (n = 5 independent experiments). Relative fluorescence intensity was normalized to neuron treated with astrocytic apoE particles. Data are presented as mean ± SEM. Statistical significance was determined with unpaired Student’s t test. ∗∗, p < 0.01, ∗∗∗, p < 0.001.
Figure 4
Figure 4
GPNMB plays a critical role in mediating neurotoxicity caused by microglial apoE particles (A) Sketched images of cultured neurons (MAP2) treated with astrocytic apoE particles, microglial apoE particles, astrocytic apoE particles with recombinant GPNMB (rGPNMB) and GPNMB KO microglial apoE particles. Scale bar, 50 μm. (B and C) Quantification of total length and branch number of cultured neuron (n = 3). (D) Representative confocal images of PSD-95 (green) and synaptophysin (red) of cultured neuron treated as mentioned above. Scale bar, 10 μm. (E and F) Quantification of PSD-95 and synaptophysin fluorescence intensity per neuron (n = 3). Relative fluorescence intensities from microglial apoE particle treated neurons were normalized to that of neurons treated with astrocytic apoE particles. (G) Examples of miniature EPSC traces recorded on cultured neurons treated as mentioned above. Scale bar, 1 s, 2 pA. (H and I) Quantification of mEPSC frequency and amplitude. At least 10 cultured neurons per group were used for the analysis. (J and L) Representative confocal images of γH2AX (J) and H3K27me3 (L) of cultured neuron treated as mentioned above. Scale bar, 10 μm. (K and M) Quantification of γH2AX (K) and H3K27me3 (M) fluorescence intensity per cell (n = 3). Relative fluorescence intensities were normalized to that of neurons treated with Vehicle. Data are presented as mean ± SEM. Statistical significance was determined with unpaired Student’s t test. n represents the number of independent experiments. ∗, p < 0.05, ∗∗, p < 0.01, ∗∗∗, p < 0.001.
Figure 5
Figure 5
Microglial APOE4 particles exhibit distinct biochemical features and severer neurotoxicity compared with microglial APOE3 particles (A and B) ApoE particles from conditioned medium of primary APOE3-TR or APOE4-TR microglia were analyzed by native gel electrophoresis. Particle sizes were defined as large (>690 kDa), medium (232 kDa–720 kDa), and small (<232 kDa). The percentages of apoE particles in different size categories were quantified. (C) Schematic diagram of microglia-neuron co-culture system. (D) Neurons co-cultured with APOE3-TR or APOE4-TR microglia were stained for MAP2. Neuronal culture without microglia in the top insert was used as the control group. Scale bar, 20 μm. (E and F) Neurite lengths (from initiation site) and numbers were quantified and normalized to that of the control. Data are presented as mean ± SEM (n = 3–5). n represents the number of independent experiments. Statistical significance was determined with t test or one-way ANOVA. ∗, p < 0.05; ∗∗∗, p < 0.001.

Similar articles

Cited by

References

    1. 2023 Alzheimer's disease facts and figures. Alzheimer's Dementia. 2023;19:1598–1695. doi: 10.1002/alz.13016. - DOI - PubMed
    1. Bu G. Apolipoprotein E and its receptors in Alzheimer's disease: pathways, pathogenesis and therapy. Nat. Rev. Neurosci. 2009;10:333–344. doi: 10.1038/nrn2620. - DOI - PMC - PubMed
    1. Blennow K., de Leon M.J., Zetterberg H. Alzheimer's disease. Lancet. 2006;368:387–403. doi: 10.1016/S0140-6736(06)69113-7. - DOI - PubMed
    1. DeTure M.A., Dickson D.W. The neuropathological diagnosis of Alzheimer's disease. Mol. Neurodegener. 2019;14:32. doi: 10.1186/s13024-019-0333-5. - DOI - PMC - PubMed
    1. Mandrekar-Colucci S., Landreth G.E. Microglia and inflammation in Alzheimer's disease. CNS Neurol. Disord. Drug Targets. 2010;9:156–167. - PMC - PubMed