. 2024 May 17;27(6):109992.
doi: 10.1016/j.isci.2024.109992. eCollection 2024 Jun 21.

Lack of memory recall in human CD4 T cells elicited by the first encounter with SARS-CoV-2

Affiliations

Lack of memory recall in human CD4 T cells elicited by the first encounter with SARS-CoV-2

Katherine A Richards et al. iScience. .

Abstract

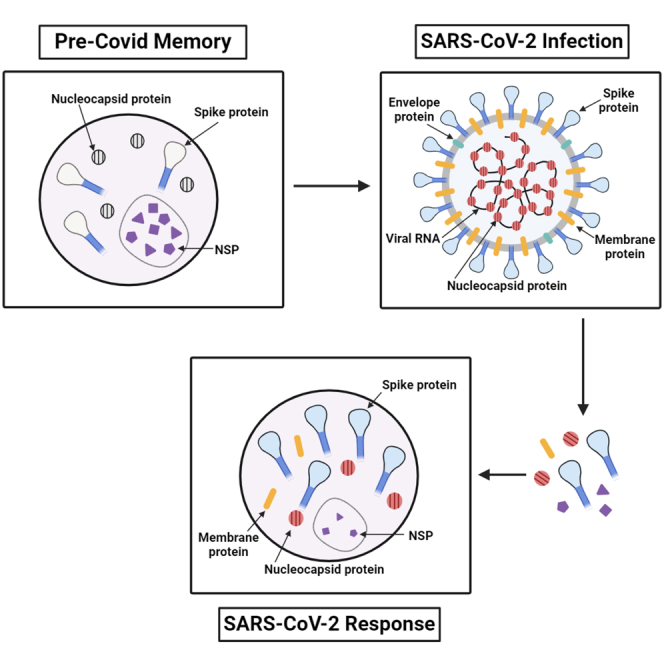
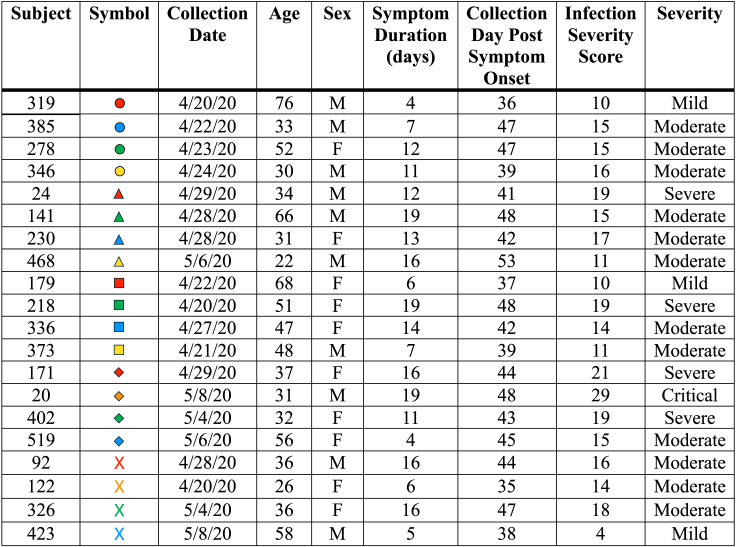
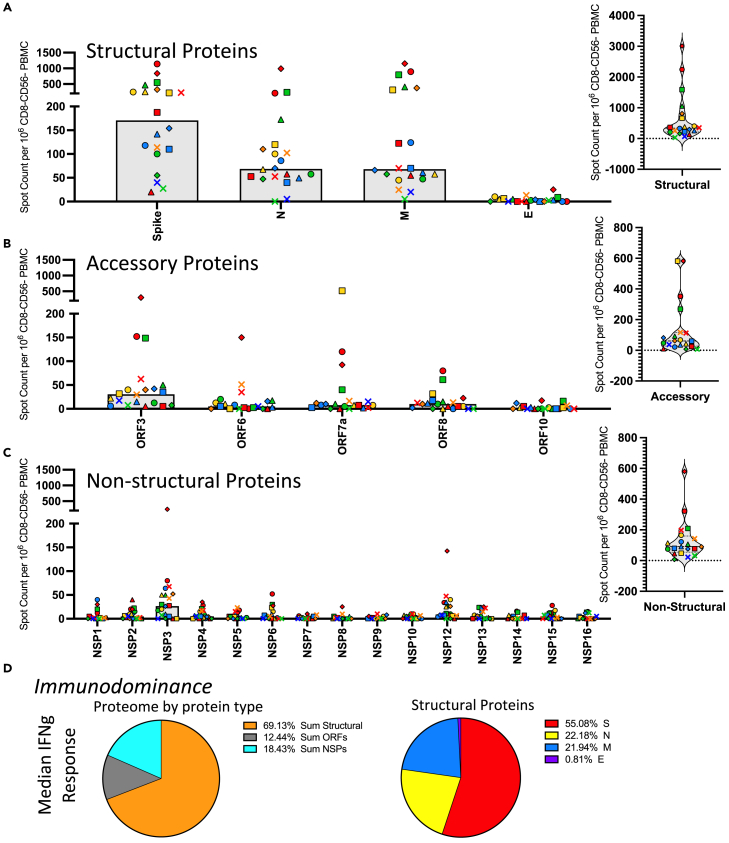
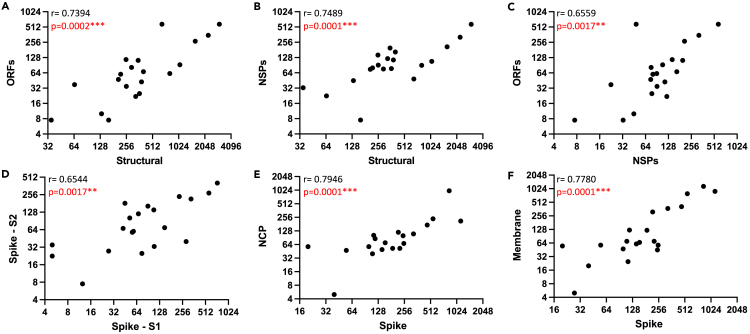
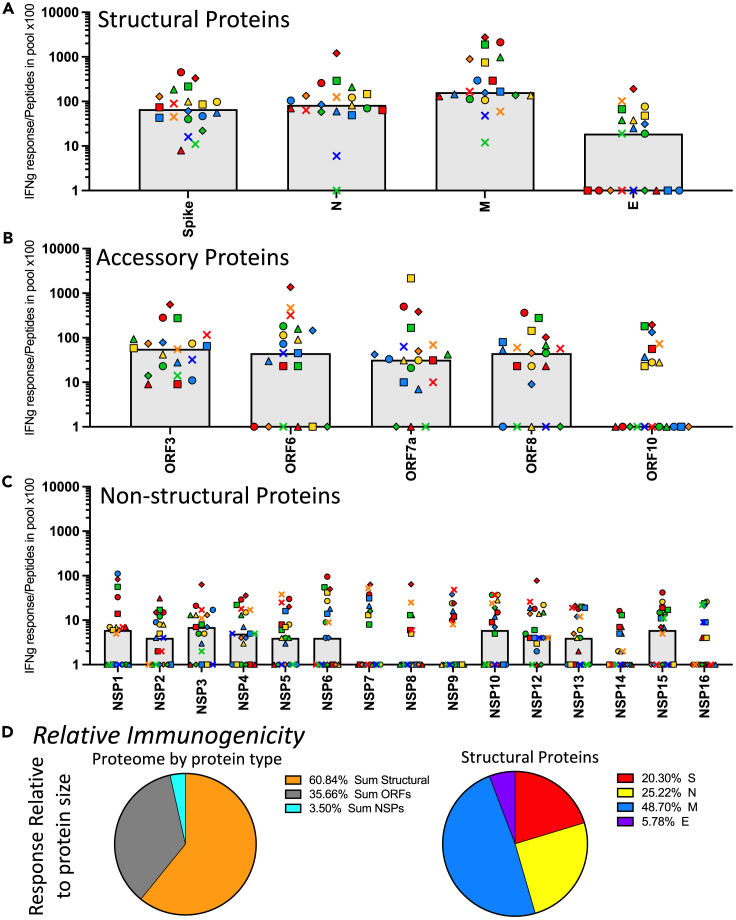
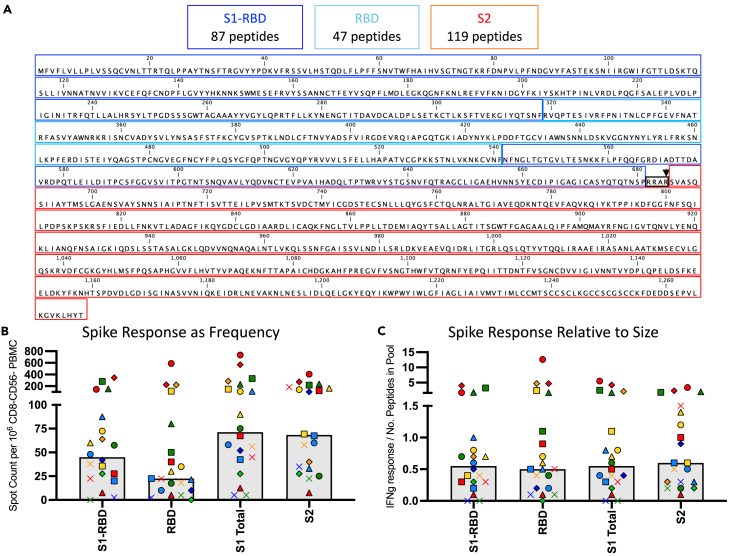
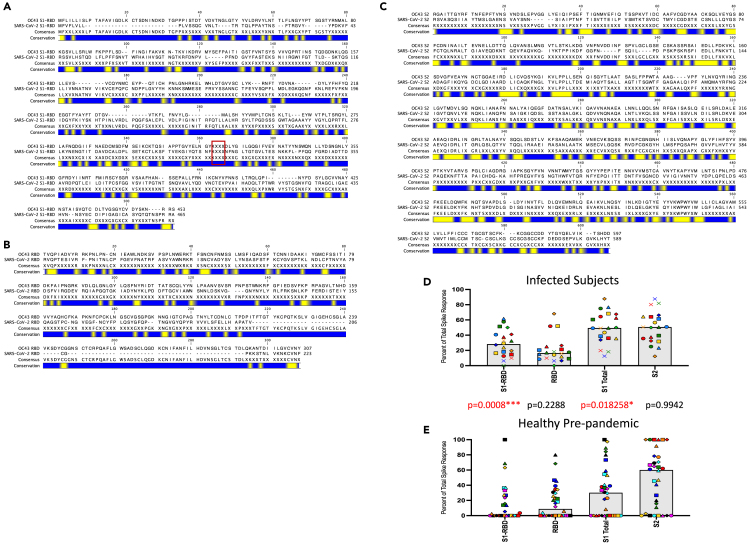
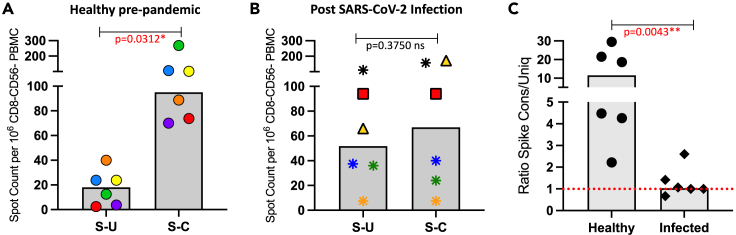
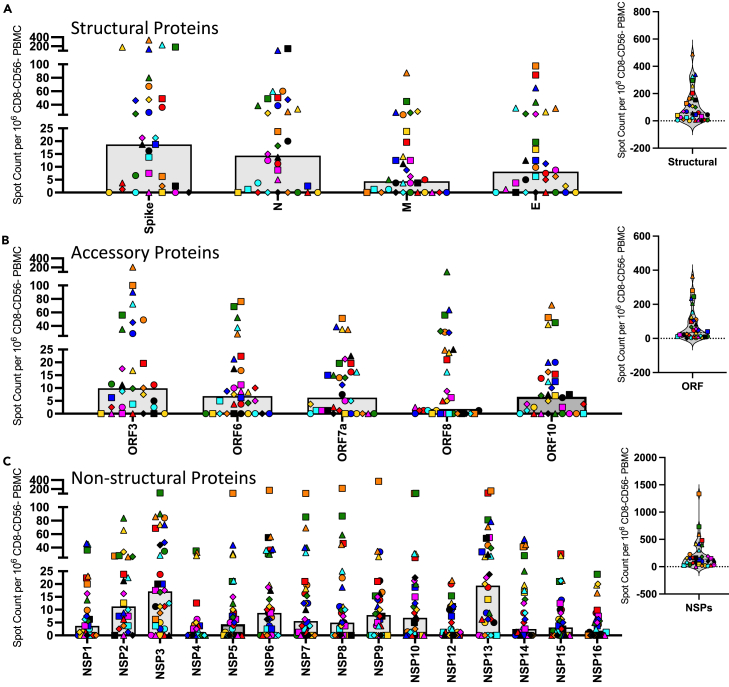
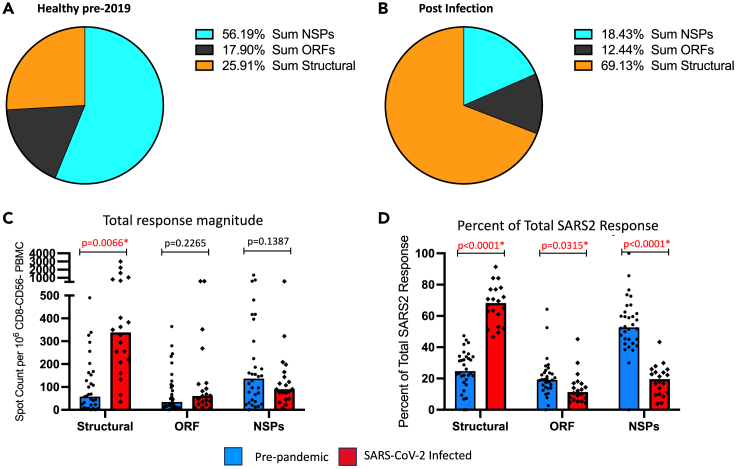
The studies reported here focus on the impact of pre-existing CD4 T cell immunity on the first encounter with SARS-CoV-2. They leverage PBMC samples from plasma donors collected after a first SARS-CoV-2 infection, prior to vaccine availability and compared to samples collected prior to the emergence of SARS-CoV-2. Analysis of CD4 T cell specificity across the entire SARS-CoV-2 proteome revealed that the recognition of SARS-CoV-2-derived epitopes by CD4 memory cells prior to the pandemic are enriched for reactivity toward non-structural proteins conserved across endemic CoV strains. However, CD4 T cells after primary infection with SARS-CoV-2 focus on epitopes from structural proteins. We observed little evidence for preferential recall to epitopes conserved between SARS-CoV-2 and seasonal CoV, a finding confirmed through use of selectively curated conserved and SARS-unique peptides. Our data suggest that SARS-CoV-2 CD4 T cells elicited by the first infection are primarily established from the naive CD4 T cell pool.

Keywords: Health sciences; Immune response; Immunology; Virology.


Conflict of interest statement

P.G.T. has consulted or received travel support from JNJ, Pfizer, Illumina, 10X Genomics, Merck, and PACT Pharma and served on the SAB of Immunoscape, Shennon Bio, and Cytoagents. No other authors have competing interests.

Figures

None
Graphical abstract
Figure 1
Figure 1
Demographics and infection data, including the duration of symptoms, infection severity score, and defined severity based on symptomology in SARS-CoV-2 convalescent subjects collected in April and May of 2020 Infection severity score was calculated based on 12 symptoms including fatigue, cough, shortness of breath, loss of taste and smell, and fever with a potential score of up to 18. Also included in the scoring was hospitalization (not hospitalized - 0), hospitalized without oxygen (6) or with oxygen (8) and ICU admission (10). Finally, the duration of symptoms with a value of 0 (0 days) to 8 (21+ days) was included. These values lead to cumulative scores indicated in the infection severity score column (<10 to 35) and the cumulative scores we used to rank severity (<10 mild, 11–18 moderate, 19–27 severe and 28–35 critical). The exact criteria are referenced in Guthmiller et al.
Figure 2
Figure 2
CD4 T cell responses to the SARS-CoV-2 proteome in PCR infection confirmed convalescent subjects are dominated by reactivity to structural proteins and spike-specific responses CD4 T cell responses to the entire SARS-CoV-2 proteome were evaluated in 20 subjects that had PCR confirmed SARS-CoV-2 infections in April or May of 2020 at a convalescent time point (D35-53 post symptom onset). Responses were measured using IFN-γ production in Enzyme-linked (EliSpot) analyses. The proteome has been divided into three classes of proteins (A) structural proteins, (B) accessory proteins and (C) non-structural proteins. Shown are the spot count per million CD8 and CD56 depleted PBMC with background subtracted. The median CD4 T cell response to each antigen is shown as a gray bar and individual subjects are indicated by unique symbols (shown in Figure 1). The right most panels of A, B and C show the total response to these classes of SARS-CoV-2 proteins. Panel D shows the average relative immunodominance as pie charts illustrating the dominant response to the structural proteins. The peptide specific CD4 T cell frequencies were summed based on the protein class for each individual subject and the median frequency for the protein classes, structural proteins (orange), accessory proteins (gray) and non-structural proteins (turquoise) was plotted as a pie chart. In the right pie chart the structural proteins that accounted for the largest proportion of the response and were further broken down into specific structural proteins spike (red), nucleocapsid (yellow), membrane (blue), and envelope (purple).
Figure 3
Figure 3
CD4 T cell responses to SARS-CoV-2 proteins correlate The abundance of cytokine producing CD4 cells reactive with the peptides encoded by the indicated classes of proteins as well as individual structural proteins or segments were analyzed for correlation coefficients. Using XY plots, the sum of the CD4 T cell IFN-γ response to the structural proteins (X axis) was plotted against the sum of the IFN-γ CD4 T cell response to the accessory proteins (A) and the non-structural proteins (B). In panel C the response to the nonstructural and accessory proteins are correlated. In panel D the CD4 T cell IFN-γ response to S1 was plotted against the response to S2 and in panels E and F the responses to NCP and Membrane, respectively, were evaluated against the response to spike. The r and p values shown in the left corner of each panel were calculated using the Spearman correlation.
Figure 4
Figure 4
Evaluation of the immunogenicity of SARS-CoV-2 proteins demonstrates dominance of membrane and poor immunogenicity of the NSP Based on the CD4 T cell responses to the SARS-CoV-2 proteome, shown in Figure 2, the relative of immunogenicity of each protein was calculated. Responses measured using cytokine producing cells per million, shown in Figure 2, were normalized to the number of peptides contained in each pool by dividing the frequency of cytokine spots per million CD8 and CD56 depleted PBMC by the number of peptides contained in the pool (Table S1) and multiplying by 100. The immunogenicity of the SARS-CoV-2 proteome is shown in the three classes of proteins (A) structural proteins, (B) accessory proteins, and (C) non-structural proteins. Donors are indicated by unique symbols (identified in Figure 1), with the median value illustrated by a gray shaded bar. In panel D, the average immunogenicity is represented by pie diagrams. The median response of the population for the sum of the proteins from each class, relative to peptide pool size, indicating the relative immunogenicity is shown in the left pie diagram; structural proteins (orange), accessory proteins (grey), and non-structural proteins (turquoise). To the right, the relative immunogenicity of each of the structural proteins, spike (red), nucleocapsid (yellow), membrane (blue), and envelope (purple) are shown.
Figure 5
Figure 5
The CD4 T cell response to SARS-CoV-2 spike protein post infection is distributed across the spike protein (A) The amino acid sequence of the spike protein from SARS-CoV-2 is indicated as defined by 3 different segments of the protein including, S1-RBD (blue), which is the S1 segment with the RBD portion of S1 removed, RBD (turquoise) and S2 (red). These delineations formed the basis of the construction of the separate pools of peptides used for stimulation in the CD4 T cell EliSpot assay. The number of peptides contained in each segment that were pooled and used are indicated above the Figure. The CD4 T cell response measured by IFN-γ EliSpot assay to these segments of spike is shown with the frequency in Panel B and the response relative to each segment’s size and peptide number in the pool is in Panel C. The average median response is illustrated by a gray box and individual subjects are indicated by their unique symbols.
Figure 6
Figure 6
Distinct patterns of CD4 T cell immunodominance within the spike protein in post-convalescent subjects versus pre-pandemic samples Amino acid sequence alignments of spike proteins for sCoV OC43 and SARS-CoV-2, broken down in the three segments, S1-RBD (A), RBD (B) and S2 (C). Blue bars represent segments of sequence variation and yellow segments indicate stretches of sequence identity. The boxed S1-RBD segment indicates the gap in sequence where the RBD would be with XXXX. Sequence files were downloaded from PubMed (accession numbers YP_009555241.1and YP_009724390.1 for OC43 and SARS-CoV-2 spike proteins, respectively). To assess the percent of the CD4 T cell response dedicated to each segment of spike protein, the number of cytokine-producing cells elicited by each pool were summed and the percent response for each segment was divided by the total number of spike specific CD4 cells qualified multiplied by 100. Panel D shows the response from the infected convalescent samples and Panel E, results shown are from a cohort of healthy adults collected between spring 2014 and spring 2019. The average median response is illustrated by a gray box and individual subjects for each cohort are indicated by unique symbols. Between panels D (convalescent) and E (healthy) are p values calculated using the Mann-Whitney test comparing each stimulation condition for the two cohorts. p values that reach statistical significance are indicated in red font.
Figure 7
Figure 7
Healthy donor (HD) subject demographics and unique symbols Collection times are indicated by the season (S-spring/summer, W-winter, F-fall) and the year.
Figure 8
Figure 8
Reactivity of CD4 T cells to conserved peptides shared between sCoV OC43 and SARS-CoV-2 vs. peptides unique to SARS-CoV-2 suggests lack of recall of CD4 T cells from the memory pool Curated pools of peptides representing unique and conserved regions of the spike protein were designed based on alignments between seasonal CoV OC43 and SARS-CoV-2 (see Table S2). Each pool contained an equal number of peptides. CD4 T cell responses from 6 healthy adult subjects collected prior to 2019 (Panel A) and from 6 subjects following PCR confirmed SARS-CoV-2 infection (April-May 2020) at a convalescent time point (Panel B) were quantified by IFN-γ EliSpot. Shown are the spot counts per million CD8 and CD56 depleted PBMC with background subtracted. The median CD4 T cell response to each peptide pool is shown as a gray bar and individual subjects are indicated by unique symbols. Panel C illustrates the ratio of the responses to conserved vs. unique peptide pools for each individual. The red dotted line indicating a value of 1, represents an equal response between conserved and unique. p values are indicated above each plot and have been calculated using the Wilcoxon test for panels A and B and the Mann-Whitney test for panel C. Statistically significant p values are indicated in red text.
Figure 9
Figure 9
CD4 T cell responses to the entire SARS-CoV-2 proteome evaluated in 32 healthy subjects collected pre-pandemic reveals striking differences from post SARS-CoV-2 infection samples Shown are immunodominance patterns of CD4 T cells collected prior to the onset of the SARS-CoV-2 pandemic (December 2019), using the same pools of peptides as tested in results shown in Figure 2. Responses were measured using IFN-γ production in EliSpot assays. The proteome was divided into three classes of proteins (A) structural proteins, (B) accessory proteins and (C) non-structural proteins. Shown are the spot count per million CD8 and CD56 depleted PBMC with background subtracted. The median CD4 T cell response to each antigen is shown as a gray bar and individual subjects are indicated by unique symbols (Figure 7). The right most panels of A, B and C show the total response to these classes of SARS-CoV-2 proteins.
Figure 10
Figure 10
Distribution of the CD4 T cell response in pre-pandemic healthy subjects and SARS-CoV-2 convalescent subjects express distinct patterns of epitope dominance The frequencies of CD4 T cells reactive to discreet pools of peptides measured by IFNγ EliSpot assays to the entire SARS-CoV-2 proteome were evaluated in 32 healthy subjects that had been collected prior to the pandemic and 20 post-infection convalescence samples, collected in April and May of 2020, were summed for each protein group: structural, accessory and non-structural proteins. Panel A represents the median distribution of the summed SARS-CoV-2 CD4 responses in the pre-pandemic samples and panel B the distribution of sum of reactivity in the convalescent infected subjects, shown as pie charts, indicated by colors representing the response distribution. The individual subject responses are shown in panel C where blue bars indicate the median response in healthy pre-pandemic subjects and red bars depict the median response in post-infection samples. The percent of the total SARS-CoV-2 response was calculated for each protein type and illustrated in panel D as a % response distribution. Indicated above the bar graphs are the calculated p values with statistically significant values indicated in red. Statistical analysis was done using multiple unpaired t tests with Welch correction.

Similar articles

References

    1. Grifoni A., Sidney J., Vita R., Peters B., Crotty S., Weiskopf D., Sette A. SARS-CoV-2 human T cell epitopes: Adaptive immune response against COVID-19. Cell Host Microbe. 2022;30:1788. doi: 10.1016/j.chom.2022.10.017. - DOI - PMC - PubMed
    1. Sette A., Crotty S. Adaptive immunity to SARS-CoV-2 and COVID-19. Cell. 2021;184:861–880. doi: 10.1016/j.cell.2021.01.007. - DOI - PMC - PubMed
    1. Sette A., Sidney J., Crotty S. T Cell Responses to SARS-CoV-2. Annu. Rev. Immunol. 2023;41:343–373. doi: 10.1146/annurev-immunol-101721-061120. - DOI - PubMed
    1. Grifoni A., Weiskopf D., Ramirez S.I., Mateus J., Dan J.M., Moderbacher C.R., Rawlings S.A., Sutherland A., Premkumar L., Jadi R.S., et al. Targets of T Cell Responses to SARS-CoV-2 Coronavirus in Humans with COVID-19 Disease and Unexposed Individuals. Cell. 2020;181:1489–1501.e15. doi: 10.1016/j.cell.2020.05.015. - DOI - PMC - PubMed
    1. Tarke A., Sidney J., Kidd C.K., Dan J.M., Ramirez S.I., Yu E.D., Mateus J., da Silva Antunes R., Moore E., Rubiro P., et al. Comprehensive analysis of T cell immunodominance and immunoprevalence of SARS-CoV-2 epitopes in COVID-19 cases. Cell Rep. Med. 2021;2 doi: 10.1016/j.xcrm.2021.100204. - DOI - PMC - PubMed