

doi: 10.1002/imt2.135.
eCollection 2023 Nov.
Primer selection impacts the evaluation of microecological patterns in environmental microbiomes
Affiliations
- PMID: 38868223
- PMCID: PMC10989904
- DOI: 10.1002/imt2.135
Item in Clipboard
Primer selection impacts the evaluation of microecological patterns in environmental microbiomes
Imeta.
.
Abstract
This study revealed that primer selection substantially influences the taxonomic and predicted functional composition and the characterization of microecological patterns, which was not alleviated by close-reference clustering. Biases were relatively consistent across different habitats in community profiling but not in microecological patterns. These primer biases could be attributed to multiple aspects, including taxa specificity, regional hypervariability, and amplification efficiency.
© 2023 The Authors. iMeta published by John Wiley & Sons Australia, Ltd on behalf of iMeta Science.
Conflict of interest statement
The authors declare no conflict of interest.
Figures
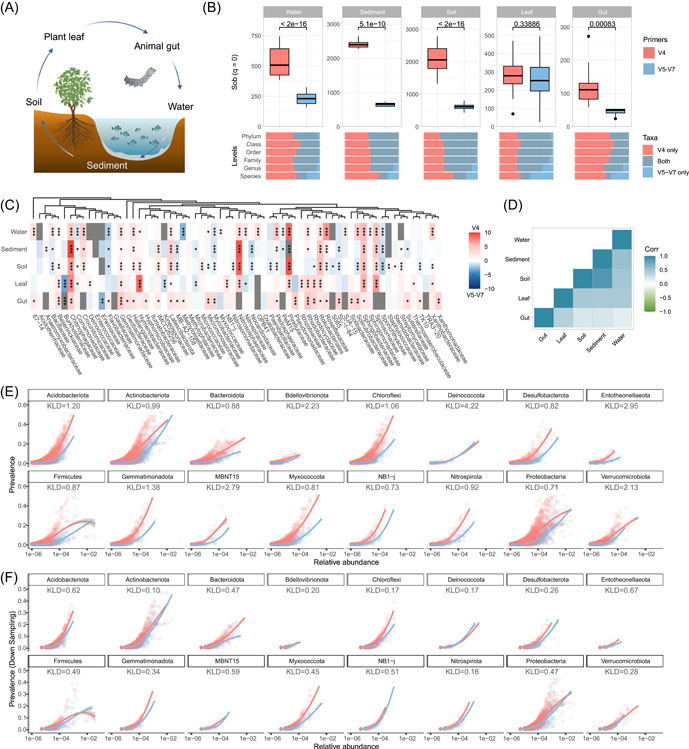
Primer bias in profiling bacterial community. (A) Overview of samples used in this study. A total of 176 biological samples (after quality control, sequence depth filtering, and sample pairing, 176 amplicon sequencing data in V4 and V5–V7, respectively) from five habitats, including water (n = 36) and sediment (n = 7) in fish‐pond, bulk soil (n = 79) and mulberry plant leaf (n = 40) in mulberry‐dyke, and silkworm gut (n = 12), were obtained from the Mulberry‐dyke and Fish‐pond system (MF). (B) Difference in the total number of species observed (Hill number q = 0, °D) of microbial communities in each habitat between different primers. Bottom panel represents the percentage of taxa that are shared and uniquely identified by primers at different levels. (C) Primer bias in the abundance of major taxonomic families in each habitat. Microbial groups were arranged according to their phylogenetic placement. Color represents the log 2‐fold ratio of abundance value of major families observed between two primer sets, indicating that taxon abundance is higher in V4 (red) or in V5–V7 (blue) data sets. Significances were calculated using the edgeR quasi‐likelihood test. (D) Consistency of primer bias in taxa abundance estimation across habitats. Color represents the correlation coefficients between the bias value vectors (log 2‐fold ratio of bias between two primer data sets in each taxon) in each habitat pair. High correlation coefficient represents that the primer bias in species abundance estimation was consistent between habitats. (E) The species abundance distribution (SAD) of amplicon sequence variants (ASVs) in major phyla. Each point represents an ASV. The line represents the Loess curve fit. The Kullback–Leibler Divergence (KLD) value represents the divergence of SAD between primer data sets. (F) SAD after down sampling. (*p ≤ 0.05, **p ≤ 0.01, ***p ≤ 0.001, and n.s. = p > 0.05.)
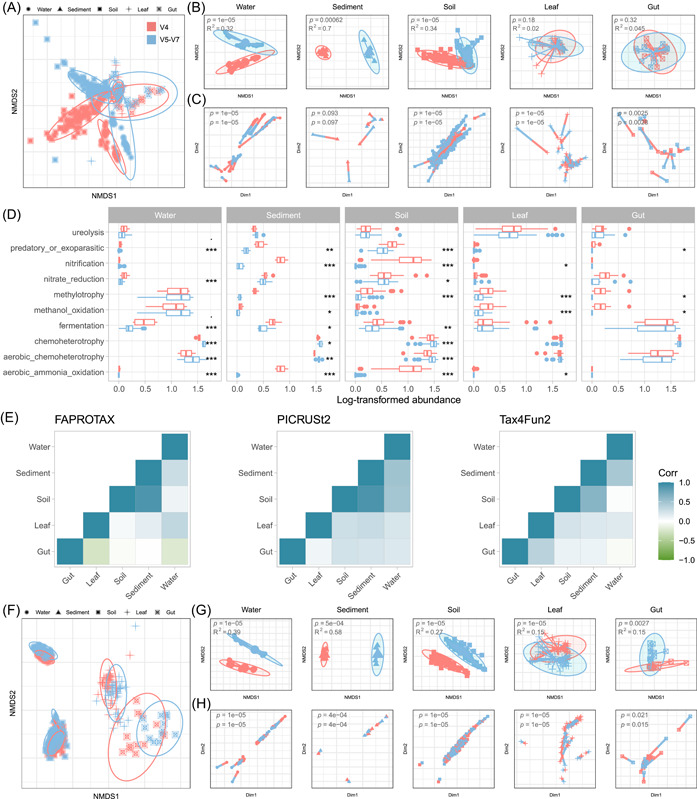
Primer bias in assessing function prediction and beta‐diversity. (A) Nonmetrix multidimensional scaling (NMDS) plot reflects primer differences in microbial predicted functional composition predicted by functional annotation of prokaryotic taxa (FAPROTAX). (B, C) NMDS plots and Procrustes plots of predicted functional composition between V4 and V5–V7 data sets in each habitat. The R
2 and p values from permutational multivariate analysis of variance compare community compositions characterized by different primers. In Procrustes plots, for a given sample, red lines connect to data from the V4 data set, while blue lines connect to points generated from the V5–V7 data set. The p values of Procrustes and Mantel tests are shown. (D) Differences of primer data sets in the abundances of major potential functions predicted by FAPROTAX (Welch t‐test). (E) Consistency of primer bias in functional composition across habitats based on FAPROTAX, Phylogenetic Investigation of Communities by Reconstruction of Unobserved States (PICRUSt2), and Tax4Fun2. Color represents the correlation coefficients between the bias value vectors (log 2‐fold ratio of bias between two primer data sets in each predicted function) in each habitat pair. High correlation coefficient represents that the primer bias in functional prediction was consistent between habitats. (F) NMDS plot reflects primer differences in microbial taxonomic composition at the genus level. (G, H) NMDS and Procrustes plots of taxonomic composition between V4 and V5–V7 data sets in each habitat.
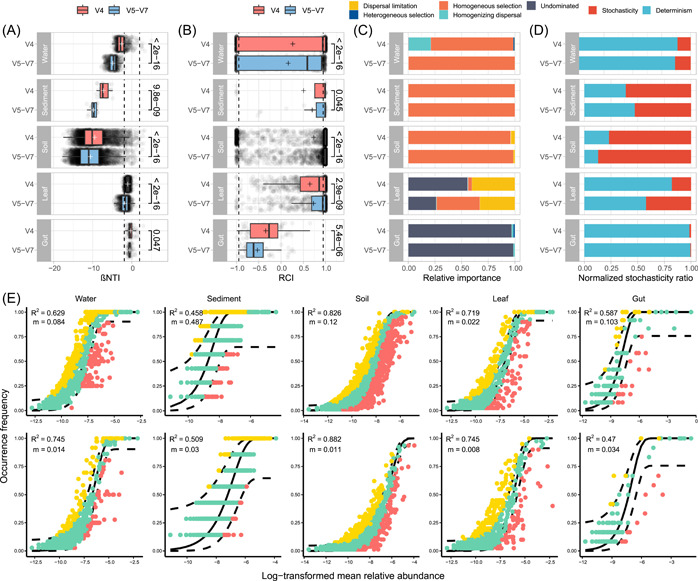
Primer bias in evaluating the community assembly process. STEN analysis based on βNTI (A) and RCI (B) for all pairwise community comparisons in each habitat in two primer data sets. Dashed lines at βNTI = −1.96 (homogeneous selection) and βNTI = 1.96 (variable selection) denote significance thresholds of phylogenetic signals. Dashed lines at RCI = −0.95 (homogenizing dispersal) and RCI = 0.95 (dispersal limitation) denote significance thresholds of taxonomic signals. Boxplots show the median (line), mean (plus sign), 25th and 75th percentiles (box), and 1.5× the interquartile range (whiskers). (C) Assembly process quantification: homogeneous selection (βNTI < −1.96; determinism), heterogeneous selection (βNTI > 1.96; determinism), homogeneous dispersal (|βNTI| < 1.96 and RCI > 0.95; stochasticity), dispersal limitation (|βNTI| < 1.96 and RCI < −0.95; stochasticity), and undominated processes (|βNTI| < 1.96 and |RCI| < 0.95, for example, weak selection, weak dispersal, diversification, and drift; stochasticity). (D) NST analysis quantifying taxonomic normalized stochasticity ratio in each habitat in two primer data sets. (E) SLON fitness indicated by R
2 values (fit to neutral assembly process) and m values (estimated migration rate) in each habitat in two primer data sets. Each point represents an amplicon sequence variant (ASV) colored based on the comparison of the actual taxon distribution (solid line) and 95% confidence interval (dashed lines) of model prediction, whether the ASV is above (yellow), below (red), or neutral (dark green). NST, Ning's normalized stochastic ratio model; RCI, Raup–Crick Index; SLON, Sloan's neutral model; STEN, Stegen's null model; βNTI, β‐nearest‐taxon index.
Similar articles
-
The Impact of Primer Design on Amplicon-Based Metagenomic Profiling Accuracy: Detailed Insights into Bifidobacterial Community Structure.Microorganisms. 2020 Jan 17;8(1):131. doi: 10.3390/microorganisms8010131. Microorganisms. 2020. PMID: 31963501 Free PMC article.
-
Fine-scale evaluation of two standard 16S rRNA gene amplicon primer pairs for analysis of total prokaryotes and archaeal nitrifiers in differently managed soils.Front Microbiol. 2023 Feb 23;14:1140487. doi: 10.3389/fmicb.2023.1140487. eCollection 2023. Front Microbiol. 2023. PMID: 36910167 Free PMC article.
-
Performance of 16s rDNA Primer Pairs in the Study of Rhizosphere and Endosphere Bacterial Microbiomes in Metabarcoding Studies.Front Microbiol. 2016 May 13;7:650. doi: 10.3389/fmicb.2016.00650. eCollection 2016. Front Microbiol. 2016. PMID: 27242686 Free PMC article.
-
Effects of Microecological Preparations on Obese Patients after Bariatric Surgery: A Systematic Review and Meta-Analysis.Evid Based Complement Alternat Med. 2020 May 31;2020:8724546. doi: 10.1155/2020/8724546. eCollection 2020. Evid Based Complement Alternat Med. 2020. PMID: 32595746 Free PMC article. Review.
-
Exploring the effect of microecological agents on postoperative immune function in patients undergoing liver cancer surgery: a systematic review and meta-analysis.Ann Palliat Med. 2021 Nov;10(11):11615-11627. doi: 10.21037/apm-21-2669. Ann Palliat Med. 2021. PMID: 34872286
Cited by
-
Asymbiotic Nitrogen Fixation in the Phyllosphere of Urban Green Spaces.Curr Microbiol. 2025 May 3;82(6):276. doi: 10.1007/s00284-025-04250-w. Curr Microbiol. 2025. PMID: 40319203
-
Insect Insights at the Single-Cell Level: Technologies and Applications.Cells. 2023 Dec 31;13(1):91. doi: 10.3390/cells13010091. Cells. 2023. PMID: 38201295 Free PMC article. Review.
-
Pathogenicity and host-interacting mechanisms of enterogenic Enterobacter cancerogenus in silkworm.Front Microbiol. 2025 Mar 26;16:1548808. doi: 10.3389/fmicb.2025.1548808. eCollection 2025. Front Microbiol. 2025. PMID: 40207159 Free PMC article.
-
Fitness effects of synthetic and natural diet preservatives on the edible insect Bombyx mori.NPJ Sci Food. 2024 Jun 22;8(1):39. doi: 10.1038/s41538-024-00284-9. NPJ Sci Food. 2024. PMID: 38909075 Free PMC article.
-
Improving the reporting of metagenomic virome-scale data.Commun Biol. 2024 Dec 20;7(1):1687. doi: 10.1038/s42003-024-07212-3. Commun Biol. 2024. PMID: 39706917 Free PMC article.
References
-
- Fischer, Martin A. , Güllert Simon, Neulinger Sven C., Streit Wolfgang R., and Schmitz Ruth A.. 2016. “Evaluation of 16S rRNA Gene Primer Pairs for Monitoring Microbial Community Structures Showed High Reproducibility Within and Low Comparability Between Datasets Generated With Multiple Archaeal and Bacterial Primer Pairs.” Frontiers in Microbiology 7: 1297. 10.3389/fmicb.2016.01297 - DOI - PMC - PubMed
-
- Li, Changchao , Jin Ling, Zhang Chao, Li Shuzhen, Zhou Tong, Hua Zhongyi, Wang Lifei, et al. 2023. “Destabilized Microbial Networks With Distinct Performances of Abundant and Rare Biospheres in Maintaining Networks Under Increasing Salinity Stress.” iMeta 2: e79. 10.1002/imt2.79 - DOI - PMC - PubMed
LinkOut - more resources
Full Text Sources