

Ecological dynamics imposes fundamental challenges in community-based microbial source tracking
- PMID: 38868341
- PMCID: PMC10989786
- DOI: 10.1002/imt2.75
Ecological dynamics imposes fundamental challenges in community-based microbial source tracking
Erratum in
-
Correction to "ecological dynamics imposes fundamental challenges in community-based microbial source tracking".Imeta. 2023 Oct 19;2(4):e145. doi: 10.1002/imt2.145. eCollection 2023 Nov. Imeta. 2023. PMID: 38868228 Free PMC article.
Abstract
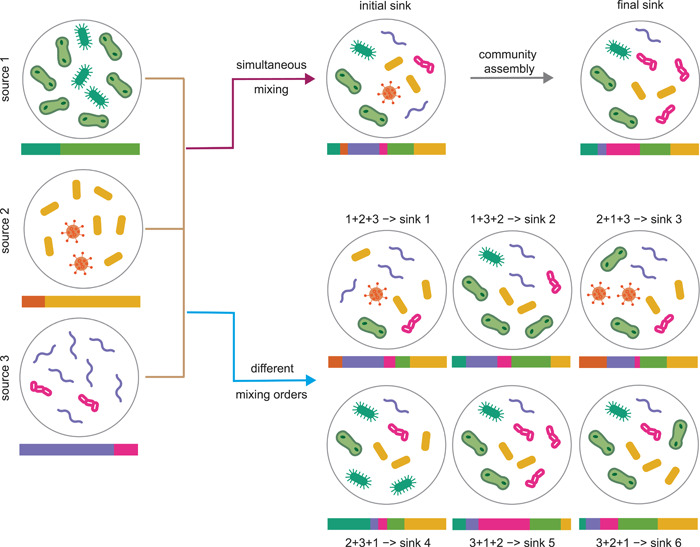
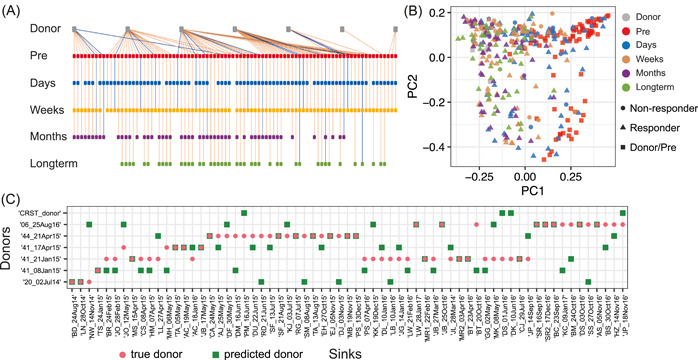
Quantifying the contributions of possible environmental sources ("sources") to a specific microbial community ("sink") is a classical problem in microbiology known as microbial source tracking (MST). Solving the MST problem will not only help us understand how microbial communities were formed, but also have far-reaching applications in pollution control, public health, and forensics. MST methods generally fall into two categories: target-based methods (focusing on the detection of source-specific indicator species or chemicals); and community-based methods (using community structure to measure similarity between sink samples and potential source environments). As next-generation sequencing becomes a standard community-assessment method in microbiology, numerous community-based computational methods, referred to as MST solvers hereafter have been developed and applied to various real datasets to demonstrate their utility across different contexts. Yet, those MST solvers do not consider microbial interactions and priority effects in microbial communities. Here, we revisit the performance of several representative MST solvers. We show compelling evidence that solving the MST problem using existing MST solvers is impractical when ecological dynamics plays a role in community assembly. In particular, we clearly demonstrate that the presence of either microbial interactions or priority effects will render the MST problem mathematically unsolvable for MST solvers. We further analyze data from fecal microbiota transplantation studies, finding that the state-of-the-art MST solvers fail to identify donors for most of the recipients. Finally, we perform community coalescence experiments to demonstrate that the state-of-the-art MST solvers fail to identify the sources for most of the sinks. Our findings suggest that ecological dynamics imposes fundamental challenges in MST. Interpretation of results of existing MST solvers should be done cautiously.
Keywords: microbial interactions; microbial source tracking; priority effects.
© 2023 The Authors. iMeta published by John Wiley & Sons Australia, Ltd on behalf of iMeta Science.
Conflict of interest statement
The authors declare no conflict of interest.
Figures


Similar articles
-
Fecal pollution: new trends and challenges in microbial source tracking using next-generation sequencing.Environ Microbiol. 2018 Sep;20(9):3132-3140. doi: 10.1111/1462-2920.14281. Epub 2018 Aug 5. Environ Microbiol. 2018. PMID: 29797757 Review.
-
Influence of Library Composition on SourceTracker Predictions for Community-Based Microbial Source Tracking.Environ Sci Technol. 2019 Jan 2;53(1):60-68. doi: 10.1021/acs.est.8b04707. Epub 2018 Dec 6. Environ Sci Technol. 2019. PMID: 30475593
-
Microbial source tracking: a forensic technique for microbial source identification?J Environ Monit. 2007 May;9(5):427-39. doi: 10.1039/b617059e. Epub 2007 Apr 23. J Environ Monit. 2007. PMID: 17492088
-
New insight into identifying sediment phosphorus sources in multi-source polluted urban river: Effect of environmental-induced microbial community succession on stability of microbial source tracking results.Environ Res. 2024 Apr 15;247:118215. doi: 10.1016/j.envres.2024.118215. Epub 2024 Jan 20. Environ Res. 2024. PMID: 38253194
-
Microbial source tracking using metagenomics and other new technologies.J Microbiol. 2021 Mar;59(3):259-269. doi: 10.1007/s12275-021-0668-9. Epub 2021 Feb 10. J Microbiol. 2021. PMID: 33565053 Review.
Cited by
-
Towards more accurate microbial source tracking via non-negative matrix factorization (NMF).Bioinformatics. 2024 Jun 28;40(Suppl 1):i68-i78. doi: 10.1093/bioinformatics/btae227. Bioinformatics. 2024. PMID: 38940128 Free PMC article.
-
Interplay of ecological processes modulates microbial community reassembly following coalescence.ISME J. 2025 Jan 2;19(1):wraf041. doi: 10.1093/ismejo/wraf041. ISME J. 2025. PMID: 40178128 Free PMC article.
-
Citywide metagenomic surveillance of food centres reveals local microbial signatures and antibiotic resistance gene enrichment.NPJ Antimicrob Resist. 2025 Jul 8;3(1):63. doi: 10.1038/s44259-025-00132-0. NPJ Antimicrob Resist. 2025. PMID: 40629022 Free PMC article.
-
Assessing Engraftment Following Fecal Microbiota Transplant.ArXiv [Preprint]. 2024 Apr 10:arXiv:2404.07325v1. ArXiv. 2024. Update in: Gut Microbes. 2025 Dec;17(1):2525478. doi: 10.1080/19490976.2025.2525478. PMID: 38659636 Free PMC article. Updated. Preprint.
-
Correction to "ecological dynamics imposes fundamental challenges in community-based microbial source tracking".Imeta. 2023 Oct 19;2(4):e145. doi: 10.1002/imt2.145. eCollection 2023 Nov. Imeta. 2023. PMID: 38868228 Free PMC article.
References
-
- Cao, Yiping , Wu Cindy H., Andersen Gary L., and Holden Patricia A.. 2011. “ Community Analysis‐Based Methods .” In Microbial Source Tracking: Methods, Applications, and Case Studies, edited by Charles Hagedorn, Anicet R. Blanch, and Valerie J. Harwood, 251–82. New York, NY: Springer. 10.1007/978-1-4419-9386-1_11 - DOI
-
- Rock, Channah , Rivera Berenise, and Gerba Charles P.. 2015. “Chapter 14 ‐ Microbial Source Tracking.” Environmental Microbiology: 309–17. 10.1016/b978-0-12-394626-3.00014-4 - DOI
-
- Devane, Megan L. , Weaver Louise, Singh Shailesh K., and Gilpin Brent J.. 2018. “Fecal Source Tracking Methods to Elucidate Critical Sources of Pathogens and Contaminant Microbial Transport Through New Zealand Agricultural Watersheds: A Review.” Journal of Environmental Management 222: 293–303. 10.1016/j.jenvman.2018.05.033 - DOI - PubMed
-
- Green, Hyatt C. , Haugland Richard A., Varma Manju, Millen Hana T., Borchardt Mark A., Field Katharine G., Walters William A., et al. 2014. “Improved HF183 Quantitative Real‐Time PCR Assay for Characterization of Human Fecal Pollution In Ambient Surface Water Samples.” Application of Environmental Microbiology 80: 3086–94. 10.1128/AEM.04137-13 - DOI - PMC - PubMed
Grants and funding
LinkOut - more resources
Full Text Sources
Research Materials