

EasyAmplicon: An easy-to-use, open-source, reproducible, and community-based pipeline for amplicon data analysis in microbiome research
- PMID: 38868346
- PMCID: PMC10989771
- DOI: 10.1002/imt2.83
EasyAmplicon: An easy-to-use, open-source, reproducible, and community-based pipeline for amplicon data analysis in microbiome research
Abstract
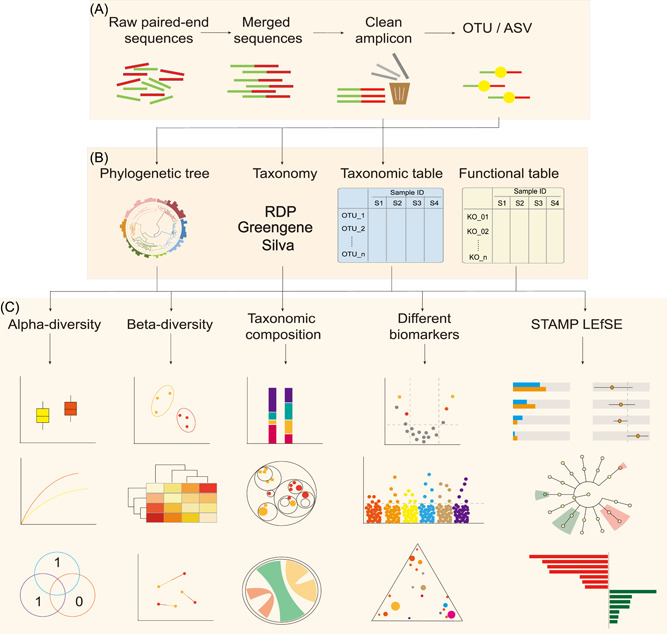
It is difficult for beginners to learn and use amplicon analysis software because there are so many software tools to choose from, and all of them need multiple steps of operation. Herein, we provide a cross-platform, open-source, and community-supported analysis pipeline EasyAmplicon. EasyAmplicon has most of the modules needed for an amplicon analysis, including data quality control, merging of paired-end reads, dereplication, clustering or denoising, chimera detection, generation of feature tables, taxonomic diversity analysis, compositional analysis, biomarker discovery, and publication-quality visualization. EasyAmplicon includes more than 30 cross-platform modules and R packages commonly used in the field. All steps of the pipeline are integrated into RStudio, which reduces learning costs, keeps the flexibility of the analysis process, and facilitates personalized analysis. The pipeline is maintained and updated by the authors and editors of WeChat official account "Meta-genome." Our team will regularly release the latest tutorials both in Chinese and English, read the feedback from users, and provide help to them in the WeChat account and GitHub. The pipeline can be deployed on various platforms, and the installation time is less than half an hour. On an ordinary laptop, the whole analysis process for dozens of samples can be completed within 3 h. The pipeline is available at GitHub (https://github.com/YongxinLiu/EasyAmplicon) and Gitee (https://gitee.com/YongxinLiu/EasyAmplicon).
Keywords: amplicon; bioinformatics; metagenome; microbiome; pipeline; visualization.
© 2023 The Authors. iMeta published by John Wiley & Sons Australia, Ltd on behalf of iMeta Science.
Conflict of interest statement
The authors declare no conflict of interest.
Figures
Similar articles
-
ASAP 2: a pipeline and web server to analyze marker gene amplicon sequencing data automatically and consistently.BMC Bioinformatics. 2022 Jan 6;23(1):27. doi: 10.1186/s12859-021-04555-0. BMC Bioinformatics. 2022. PMID: 34991446 Free PMC article.
-
Natrix: a Snakemake-based workflow for processing, clustering, and taxonomically assigning amplicon sequencing reads.BMC Bioinformatics. 2020 Nov 16;21(1):526. doi: 10.1186/s12859-020-03852-4. BMC Bioinformatics. 2020. PMID: 33198651 Free PMC article.
-
MVP: a modular viromics pipeline to identify, filter, cluster, annotate, and bin viruses from metagenomes.mSystems. 2024 Oct 22;9(10):e0088824. doi: 10.1128/msystems.00888-24. Epub 2024 Oct 1. mSystems. 2024. PMID: 39352141 Free PMC article.
-
SLIM: a flexible web application for the reproducible processing of environmental DNA metabarcoding data.BMC Bioinformatics. 2019 Feb 19;20(1):88. doi: 10.1186/s12859-019-2663-2. BMC Bioinformatics. 2019. PMID: 30782112 Free PMC article.
-
A practical guide to amplicon and metagenomic analysis of microbiome data.Protein Cell. 2021 May;12(5):315-330. doi: 10.1007/s13238-020-00724-8. Epub 2020 May 11. Protein Cell. 2021. PMID: 32394199 Free PMC article. Review.
Cited by
-
Seasonal changes in invertebrate diet of breeding black-necked cranes (Grus nigricollis).Ecol Evol. 2024 Aug 29;14(9):e70234. doi: 10.1002/ece3.70234. eCollection 2024 Sep. Ecol Evol. 2024. PMID: 39219571 Free PMC article.
-
EnsembleSeq: a workflow towards real-time, rapid, and simultaneous multi-kingdom-amplicon sequencing for holistic and resource-effective microbiome research at scale.Microbiol Spectr. 2024 Jun 4;12(6):e0415023. doi: 10.1128/spectrum.04150-23. Epub 2024 Apr 30. Microbiol Spectr. 2024. PMID: 38687072 Free PMC article.
-
Fungal-bacteria interactions provide shelter for bacteria in Caesarean section scar diverticulum.Elife. 2024 May 1;12:RP90363. doi: 10.7554/eLife.90363. Elife. 2024. PMID: 38690990 Free PMC article.
-
Captive environments reshape the compositions of carbohydrate active enzymes and virulence factors in wolf gut microbiome.BMC Microbiol. 2025 Mar 15;25(1):142. doi: 10.1186/s12866-025-03863-2. BMC Microbiol. 2025. PMID: 40087549 Free PMC article.
-
Lactiplantibacillus plantarum Lp05 protects against ethanol-induced liver injury in zebrafish through metabolic and microbiota modulation.Sci Rep. 2025 Jul 2;15(1):22584. doi: 10.1038/s41598-025-07111-5. Sci Rep. 2025. PMID: 40593078 Free PMC article.
References
LinkOut - more resources
Full Text Sources