

Investigation of activation-induced markers (AIM) in porcine T cells by flow cytometry
- PMID: 38868498
- PMCID: PMC11168203
- DOI: 10.3389/fvets.2024.1390486
Investigation of activation-induced markers (AIM) in porcine T cells by flow cytometry
Abstract
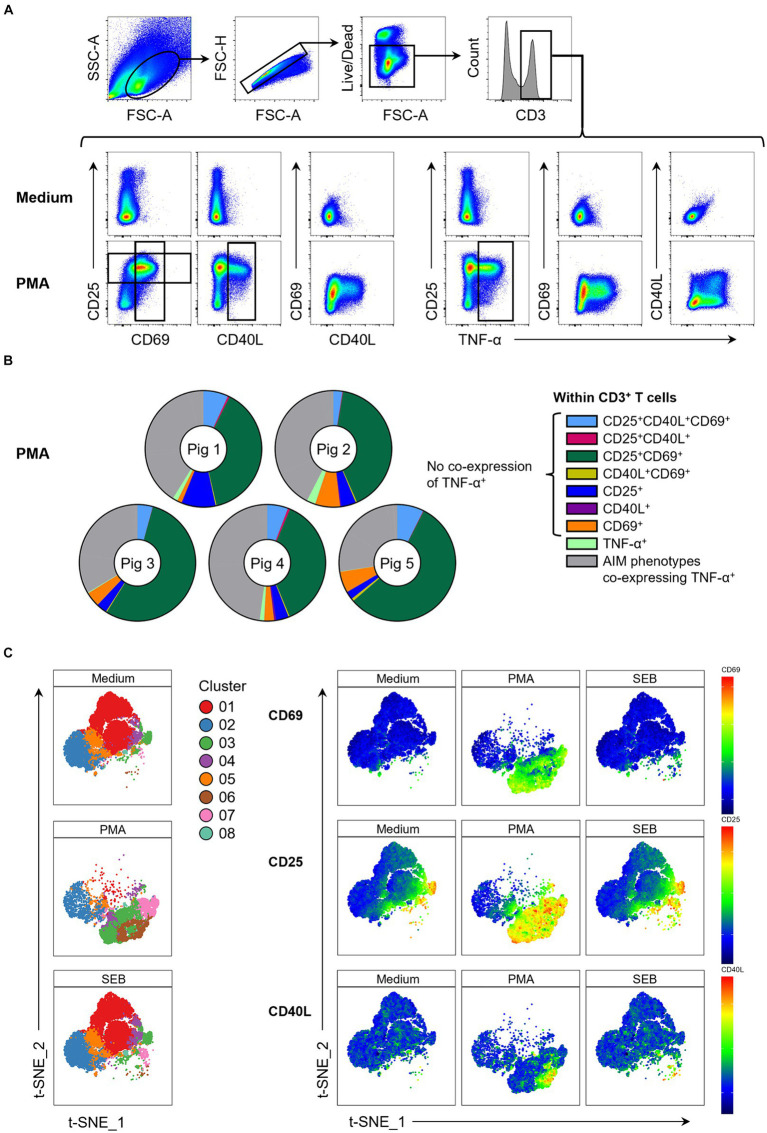
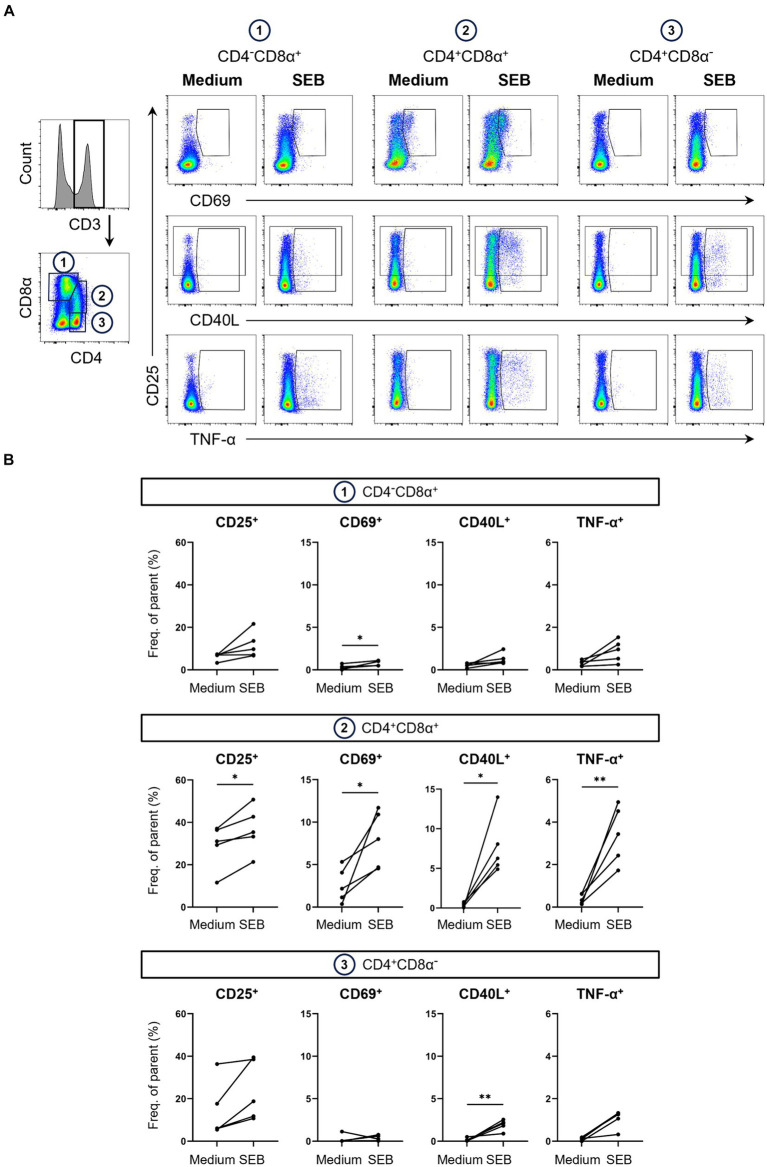
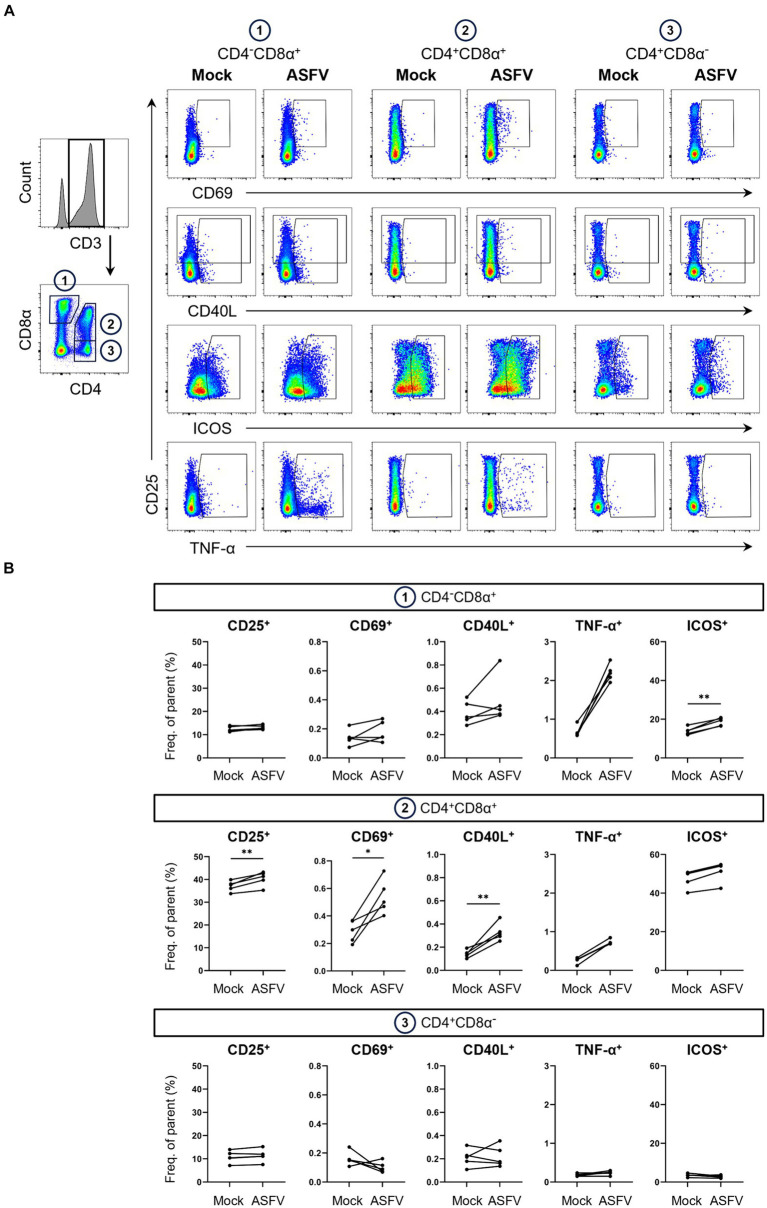
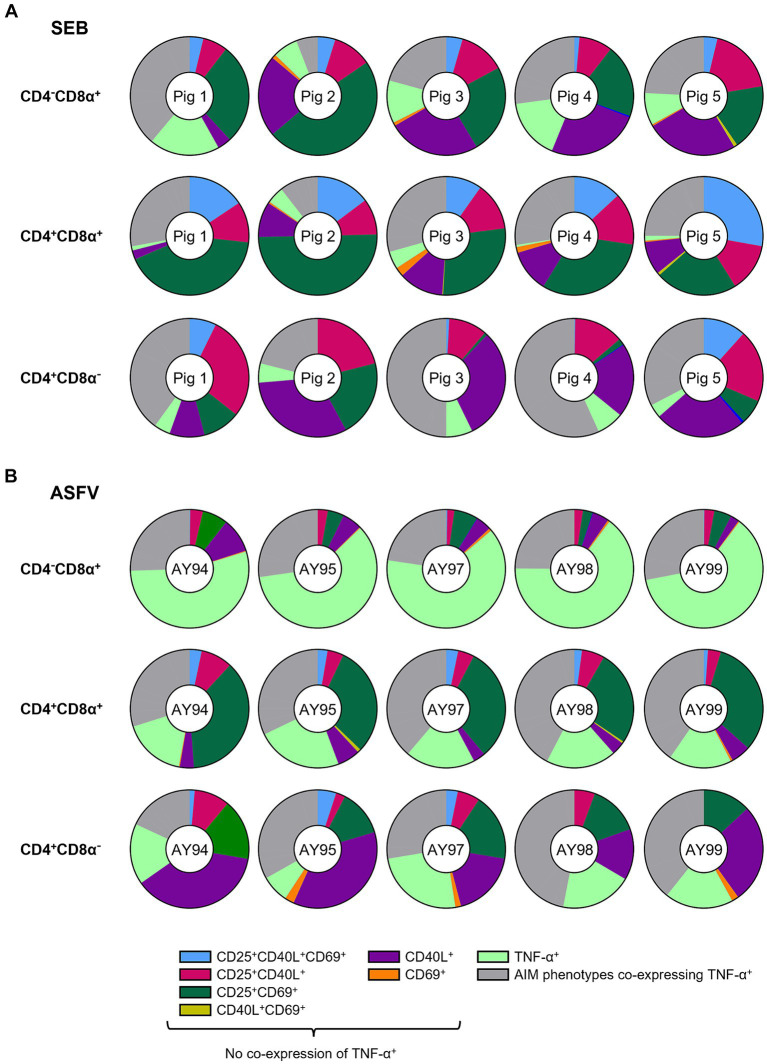
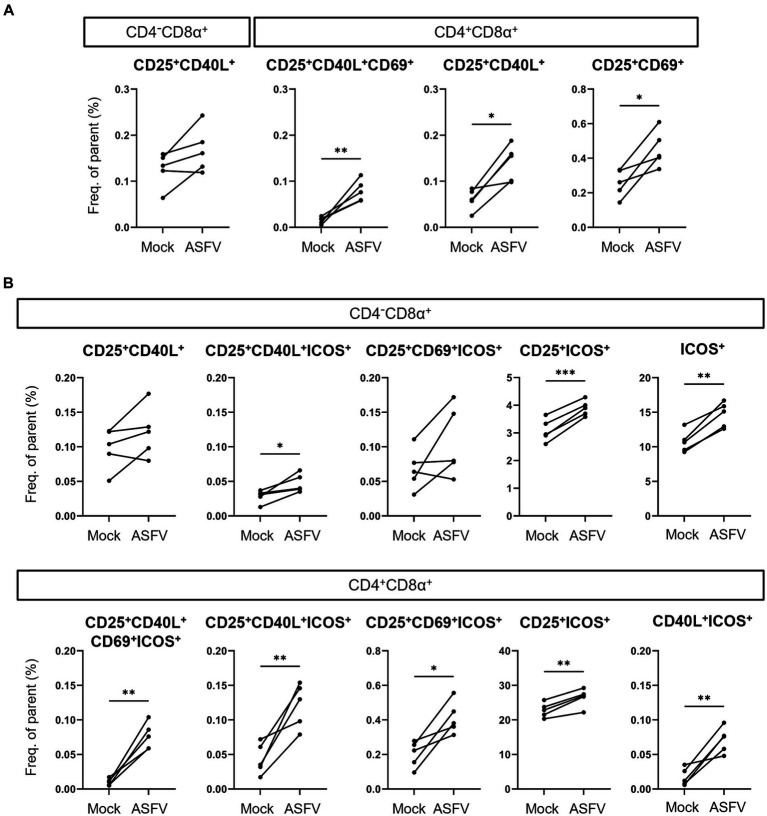
Activation-induced markers (AIMs) are frequently analyzed to identify re-activated human memory T cells. However, in pigs the analysis of AIMs is still not very common. Based on available antibodies, we designed a multi-color flow cytometry panel comprising pig-specific or cross-reactive antibodies against CD25, CD69, CD40L (CD154), and ICOS (CD278) combined with lineage/surface markers against CD3, CD4, and CD8α. In addition, we included an antibody against tumor necrosis factor alpha (TNF-α), to study the correlation of AIM expression with the production of this abundant T cell cytokine. The panel was tested on peripheral blood mononuclear cells (PBMCs) stimulated with phorbol 12-myristate 13-acetate (PMA)/ionomycin, Staphylococcus enterotoxin B (SEB) or PBMCs from African swine fever virus (ASFV) convalescent pigs, restimulated with homologous virus. PMA/ionomycin resulted in a massive increase of CD25/CD69 co-expressing T cells of which only a subset produced TNF-α, whereas CD40L expression was largely associated with TNF-α production. SEB stimulation triggered substantially less AIM expression than PMA/ionomycin but also here CD25/CD69 expressing T cells were identified which did not produce TNF-α. In addition, CD40L-single positive and CD25+CD69+CD40L+TNF-α- T cells were identified. In ASFV restimulated T cells TNF-α production was associated with a substantial proportion of AIM expressing T cells but also here ASFV-reactive CD25+CD69+TNF-α- T cells were identified. Within CD8α+ CD4 T cells, several CD25/CD40L/CD69/ICOS defined phenotypes expanded significantly after ASFV restimulation. Hence, the combination of AIMs tested will allow the identification of primed T cells beyond the commonly used cytokine panels, improving capabilities to identify the full breadth of antigen-specific T cells in pigs.
Keywords: African swine fever virus; CD25; CD40L; CD69; ICOS; SEB; activation-induced markers; pig.
Copyright © 2024 Moorton, Tng, Inoue, Netherton, Gerner and Schmidt.
Conflict of interest statement
The authors declare that the research was conducted in the absence of any commercial or financial relationships that could be construed as a potential conflict of interest.
Figures
Similar articles
-
Development of a Monoclonal Antibody to Pig CD69 Reveals Early Activation of T Cells in Pig after PRRSV and ASFV Infection.Viruses. 2022 Jun 20;14(6):1343. doi: 10.3390/v14061343. Viruses. 2022. PMID: 35746813 Free PMC article.
-
OMIP-060: 30-Parameter Flow Cytometry Panel to Assess T Cell Effector Functions and Regulatory T Cells.Cytometry A. 2019 Nov;95(11):1129-1134. doi: 10.1002/cyto.a.23853. Epub 2019 Jul 23. Cytometry A. 2019. PMID: 31334913
-
Differences in the induction of induced human CD4(+) CD25(+) FoxP3(+) T-regulatory cells and CD3(+) CD8(+) CD28(-) T-suppressor cells subset phenotypes in vitro: comparison of phorbol 12-myristate 13-acetate/ionomycin and phytohemagglutinin stimulation.Transplant Proc. 2013 Jun;45(5):1822-31. doi: 10.1016/j.transproceed.2012.10.061. Transplant Proc. 2013. PMID: 23769052
-
Impaired CD40L signaling is a cause of defective IL-12 and TNF-alpha production in Sézary syndrome: circumvention by hexameric soluble CD40L.Blood. 2005 Jan 1;105(1):219-25. doi: 10.1182/blood-2004-03-1055. Epub 2004 Aug 17. Blood. 2005. PMID: 15315967
-
Generation of anti-porcine CD69 monoclonal antibodies and their usefulness to evaluate early activation of cellular immunity by flow cytometric analysis.Anim Sci J. 2018 May;89(5):825-832. doi: 10.1111/asj.12989. Epub 2018 Feb 19. Anim Sci J. 2018. PMID: 29460471
Cited by
-
Mechanism of the Proprietary Chinese Medicine "JiuLiWan" to Treat Ulcerative Colitis Revealed by Network Pharmacology, Molecular Docking, and Experimental Verification In Vitro.ACS Omega. 2025 May 6;10(19):19598-19613. doi: 10.1021/acsomega.5c00261. eCollection 2025 May 20. ACS Omega. 2025. PMID: 40415848 Free PMC article.
References
-
- Dan JM, Lindestam Arlehamn CS, Weiskopf D, da Silva AR, Havenar-Daughton C, Reiss SM, et al. . A cytokine-independent approach to identify antigen-specific human germinal center T follicular helper cells and rare antigen-specific CD4+ T cells in blood. J Immunol. (2016) 197:983–93. doi: 10.4049/jimmunol.1600318, PMID: - DOI - PMC - PubMed
LinkOut - more resources
Full Text Sources
Research Materials