

Whole transcriptome analysis revealed the regulatory network and related pathways of non-coding RNA regulating ovarian atrophy in broody hens
- PMID: 38868501
- PMCID: PMC11168117
- DOI: 10.3389/fvets.2024.1399776
Whole transcriptome analysis revealed the regulatory network and related pathways of non-coding RNA regulating ovarian atrophy in broody hens
Abstract
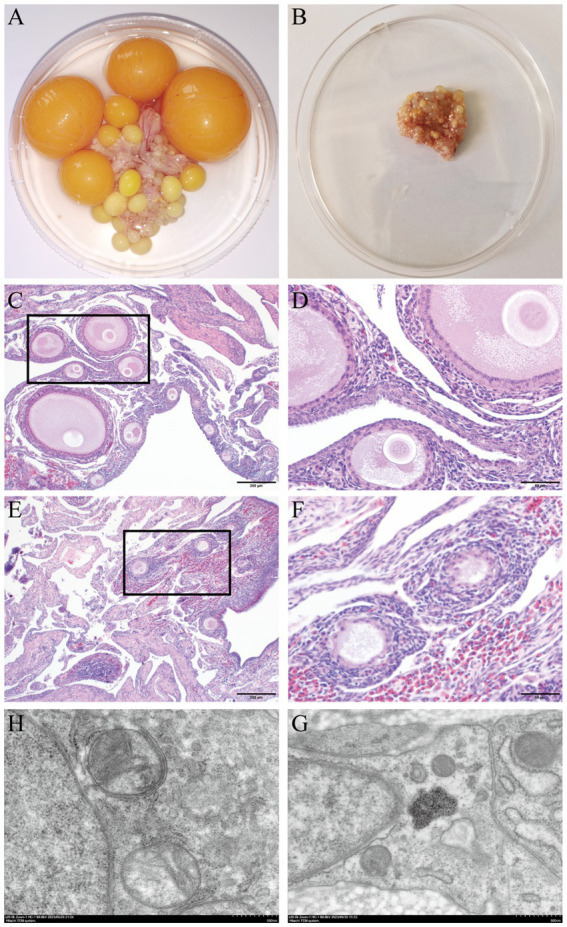
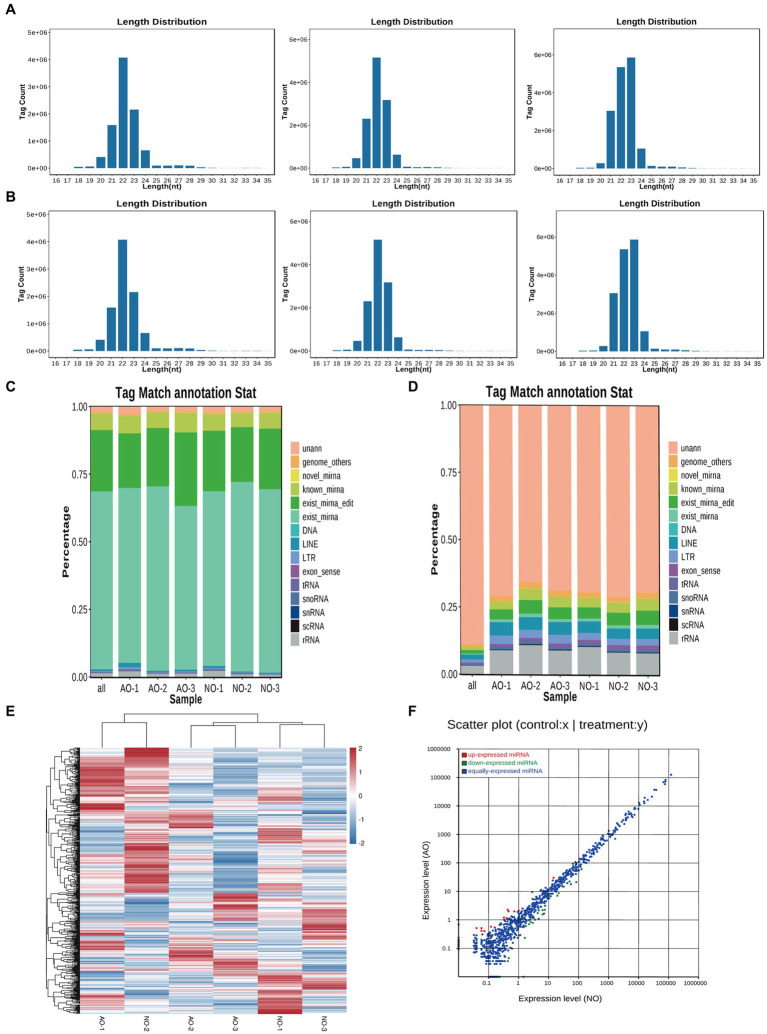
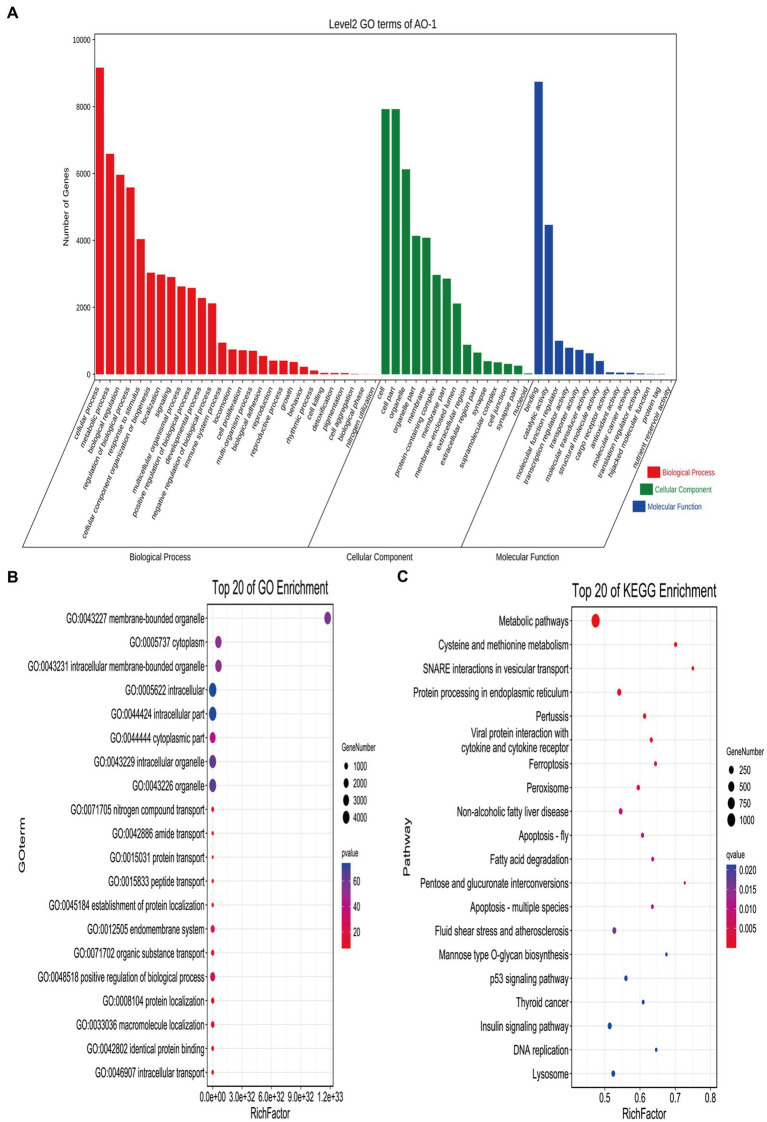
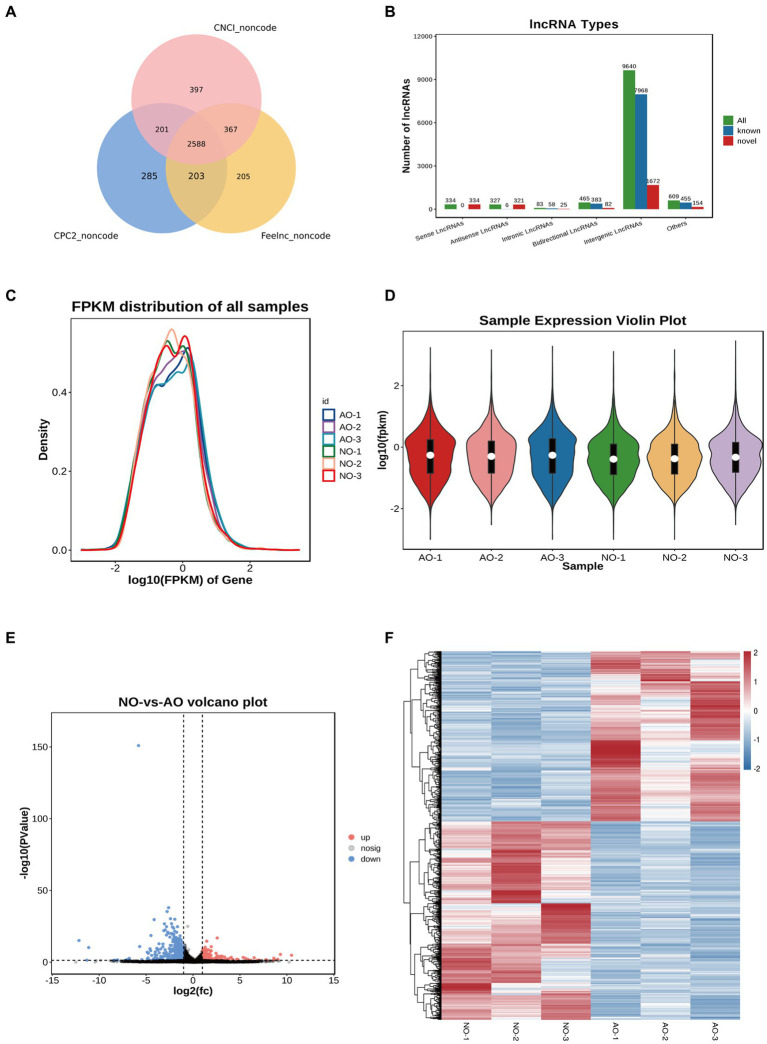
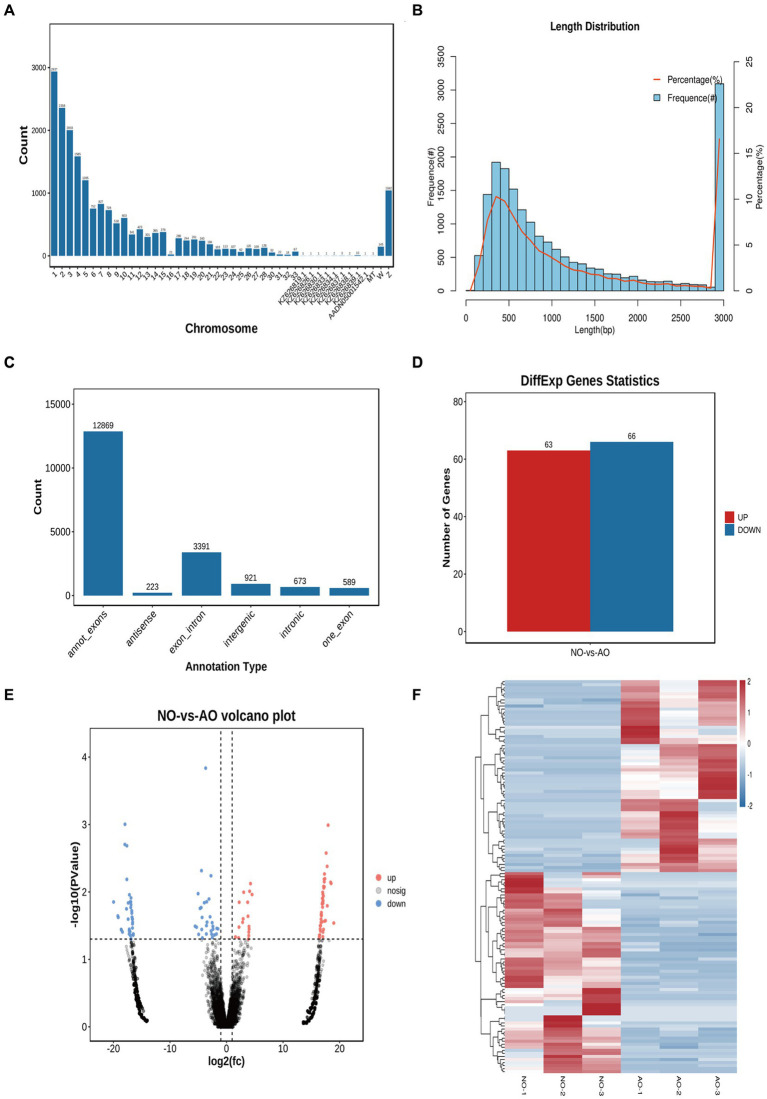
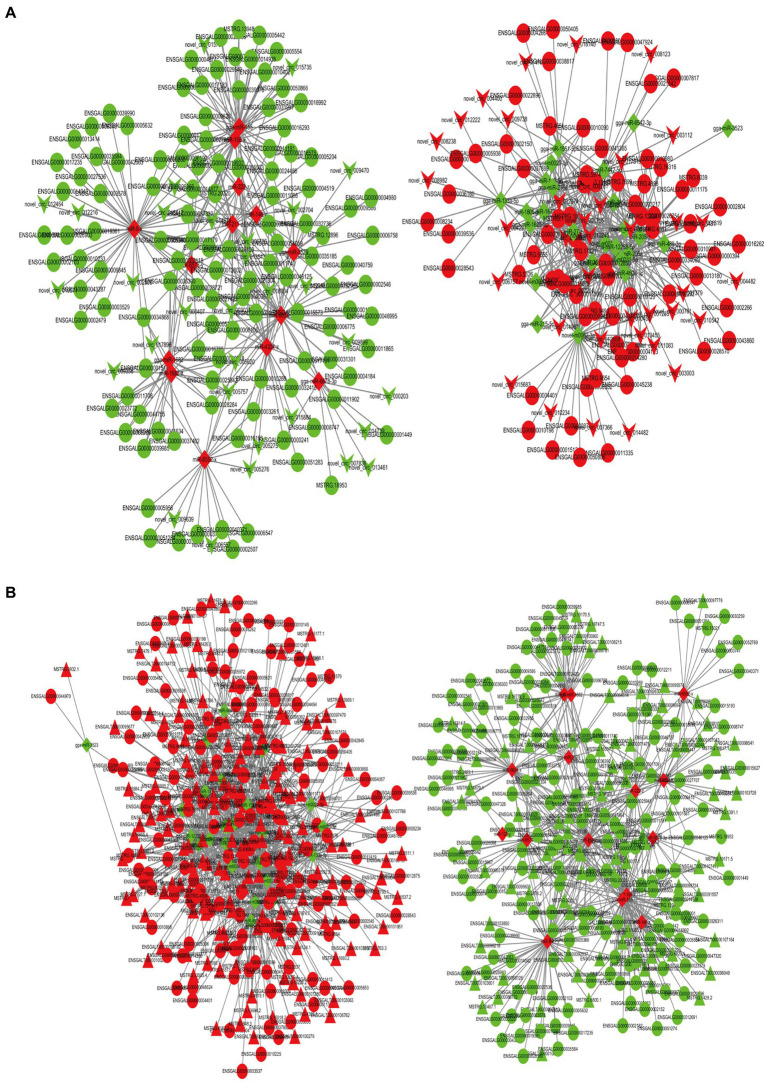
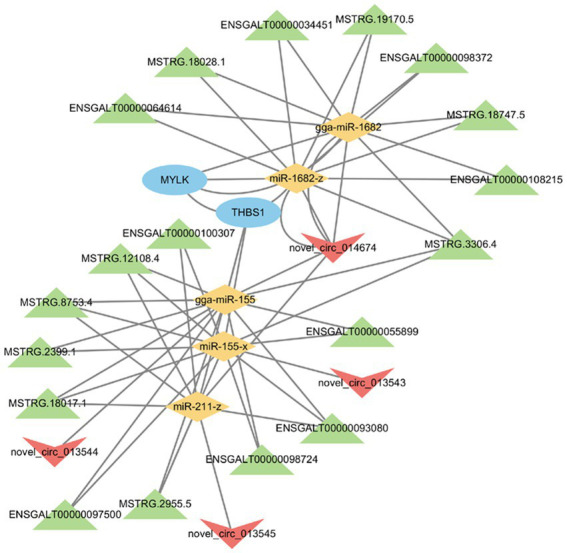
Poultry broodiness can cause ovarian atresia, which has a detrimental impact on egg production. Non-coding RNAs (ncRNAs) have become one of the most talked-about topics in life sciences because of the increasing evidence of their novel biological roles in regulatory systems. However, the molecular mechanisms of ncRNAs functions and processes in chicken ovarian development remain largely unknown. Whole-transcriptome RNA sequencing of the ovaries of broodiness and laying chickens was thus performed to identify the ncRNA regulatory mechanisms associated with ovarian atresia in chickens. Subsequent analysis revealed that the ovaries of laying chickens and those with broodiness had 40 differentially expressed MicroRNA (miRNAs) (15 up-regulated and 25 down-regulated), 379 differentially expressed Long Noncoding RNA (lncRNAs) (213 up-regulated and 166 down-regulated), and 129 differentially expressed circular RNA (circRNAs) (63 up-regulated and 66 down-regulated). The competing endogenous RNAs (ceRNA) network analysis further revealed the involvement of ECM-receptor interaction, AGE-RAGE signaling pathway, focal adhesion, cytokine-cytokine receptor interaction, inflammatory mediator regulation of TRP channels, renin secretion, gap junction, insulin secretion, serotonergic synapse, and IL-17 signaling pathways in broodiness. Upon further analysis, it became evident that THBS1 and MYLK are significant candidate genes implicated in the regulation of broodiness. The expression of these genes is linked to miR-155-x, miR-211-z, miR-1682-z, gga-miR-155, and gga-miR-1682, as well as to the competitive binding of novel_circ_014674 and MSTRG.3306.4. The findings of this study reveal the existence of a regulatory link between non-coding RNAs and their competing mRNAs, which provide a better comprehension of the ncRNA function and processes in chicken ovarian development.
Keywords: broodiness; ceRNA network; ncRNAs; ovarian development; whole transcriptome analysis.
Copyright © 2024 Xiong, Li, Wang, Wang, Tang, Cui and Liu.
Conflict of interest statement
The authors declare that the research was conducted in the absence of any commercial or financial relationships that could be construed as a potential conflict of interest.
Figures
Similar articles
-
Long noncoding RNAs and mRNAs profiling in ovary during laying and broodiness in Taihe Black-Bone Silky Fowls (Gallus gallus Domesticus Brisson).BMC Genomics. 2024 Apr 10;25(1):357. doi: 10.1186/s12864-024-10281-7. BMC Genomics. 2024. PMID: 38600449 Free PMC article.
-
Whole-transcriptome RNA sequencing reveals the global molecular responses and circRNA/lncRNA-miRNA-mRNA ceRNA regulatory network in chicken fat deposition.Poult Sci. 2022 Nov;101(11):102121. doi: 10.1016/j.psj.2022.102121. Epub 2022 Aug 9. Poult Sci. 2022. PMID: 36116349 Free PMC article.
-
Whole-transcriptome analysis of atrophic ovaries in broody chickens reveals regulatory pathways associated with proliferation and apoptosis.Sci Rep. 2018 May 8;8(1):7231. doi: 10.1038/s41598-018-25103-6. Sci Rep. 2018. PMID: 29739971 Free PMC article.
-
Study on the Relationship between the miRNA-centered ceRNA Regulatory Network and Fatigue.J Mol Neurosci. 2021 Oct;71(10):1967-1974. doi: 10.1007/s12031-021-01845-3. Epub 2021 May 16. J Mol Neurosci. 2021. PMID: 33993410 Free PMC article. Review.
-
Building a Human Ovarian Antioxidant ceRNA Network "OvAnOx": A Bioinformatic Perspective for Research on Redox-Related Ovarian Functions and Dysfunctions.Antioxidants (Basel). 2024 Sep 12;13(9):1101. doi: 10.3390/antiox13091101. Antioxidants (Basel). 2024. PMID: 39334761 Free PMC article. Review.
Cited by
-
Multi-omics analyses reveal that sirtuin 5 promotes the development of pre-recruitment follicles by inhibiting the autophagy-lysosome pathway in chicken granulosa cells.Poult Sci. 2025 Mar;104(3):104884. doi: 10.1016/j.psj.2025.104884. Epub 2025 Feb 7. Poult Sci. 2025. PMID: 39961169 Free PMC article.
-
Genome-Wide Association Analysis of Flavor Precursor Traits in Chengkou Mountain Chicken.Animals (Basel). 2025 Jun 11;15(12):1726. doi: 10.3390/ani15121726. Animals (Basel). 2025. PMID: 40564278 Free PMC article.
References
-
- Shen X, Bai X, Xu J, Zhou M, Xu HP, Nie QH, et al. . Transcriptome sequencing reveals genetic mechanisms underlying the transition between the laying and brooding phases and gene expression changes associated with divergent reproductive phenotypes in chickens. Mol Biol Rep. (2016) 43:977–89. doi: 10.1007/s11033-016-4033-8 - DOI - PubMed
LinkOut - more resources
Full Text Sources
Miscellaneous