. 2024 May 29:15:1401683.
doi: 10.3389/fimmu.2024.1401683. eCollection 2024.

Generating universal anti-CD19 CAR T cells with a defined memory phenotype by CRISPR/Cas9 editing and safety evaluation of the transcriptome

Affiliations

Generating universal anti-CD19 CAR T cells with a defined memory phenotype by CRISPR/Cas9 editing and safety evaluation of the transcriptome

Kristina Pavlovic et al. Front Immunol. .

Abstract

Introduction: Chimeric antigen receptor-expressing T cells (CAR T cells) have revolutionized cancer treatment, particularly in B cell malignancies. However, the use of autologous T cells for CAR T therapy presents several limitations, including high costs, variable efficacy, and adverse effects linked to cell phenotype.

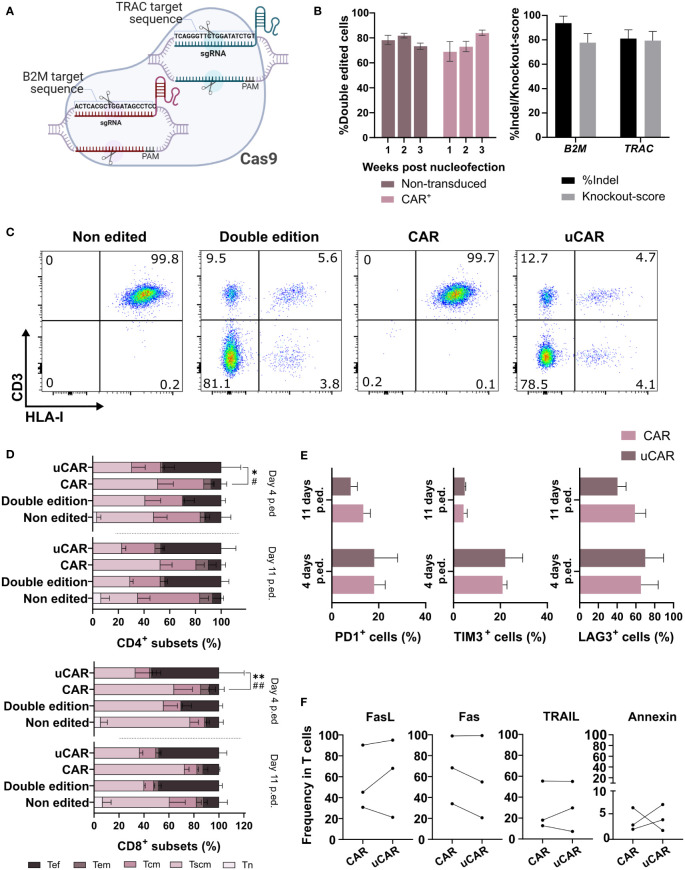
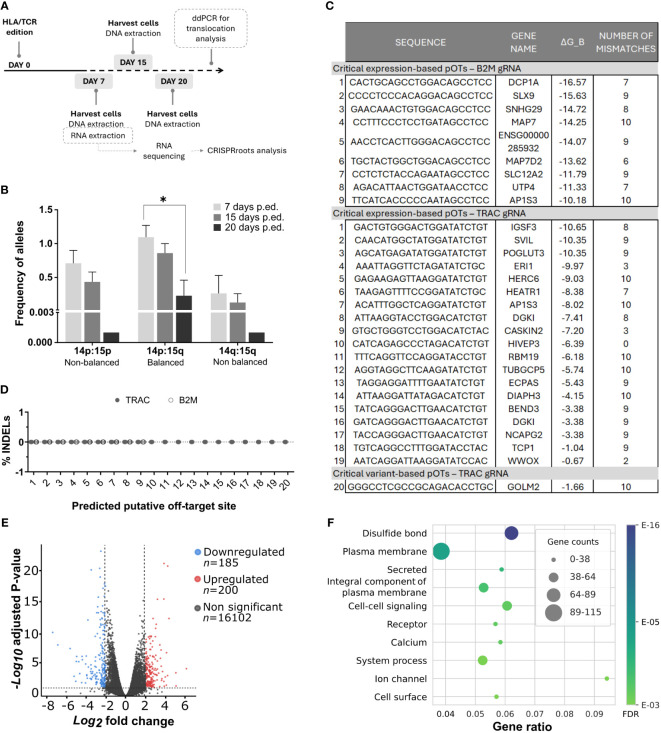
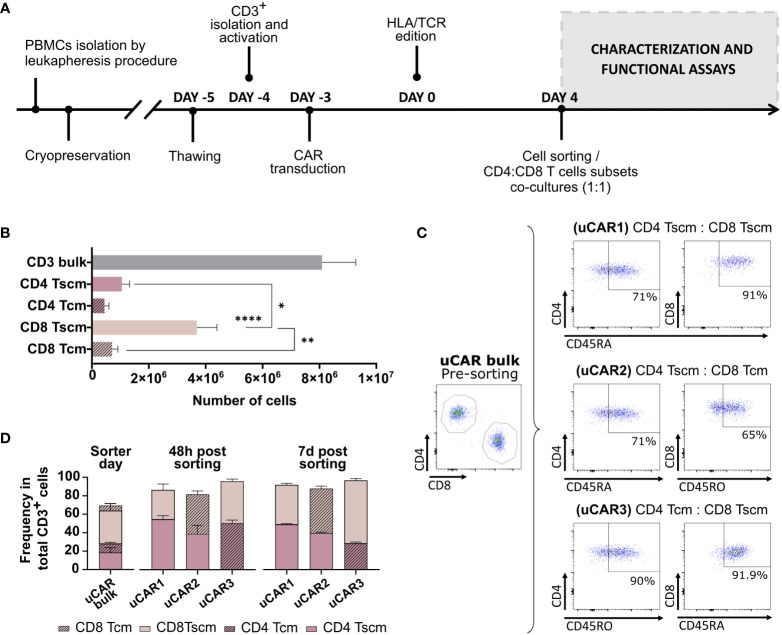
Methods: To overcome these challenges, we developed a strategy to generate universal and safe anti-CD19 CAR T cells with a defined memory phenotype. Our approach utilizes CRISPR/Cas9 technology to target and eliminate the B2M and TRAC genes, reducing graft-versus-host and host-versus-graft responses. Additionally, we selected less differentiated T cells to improve the stability and persistence of the universal CAR T cells. The safety of this method was assessed using our CRISPRroots transcriptome analysis pipeline, which ensures successful gene knockout and the absence of unintended off-target effects on gene expression or transcriptome sequence.

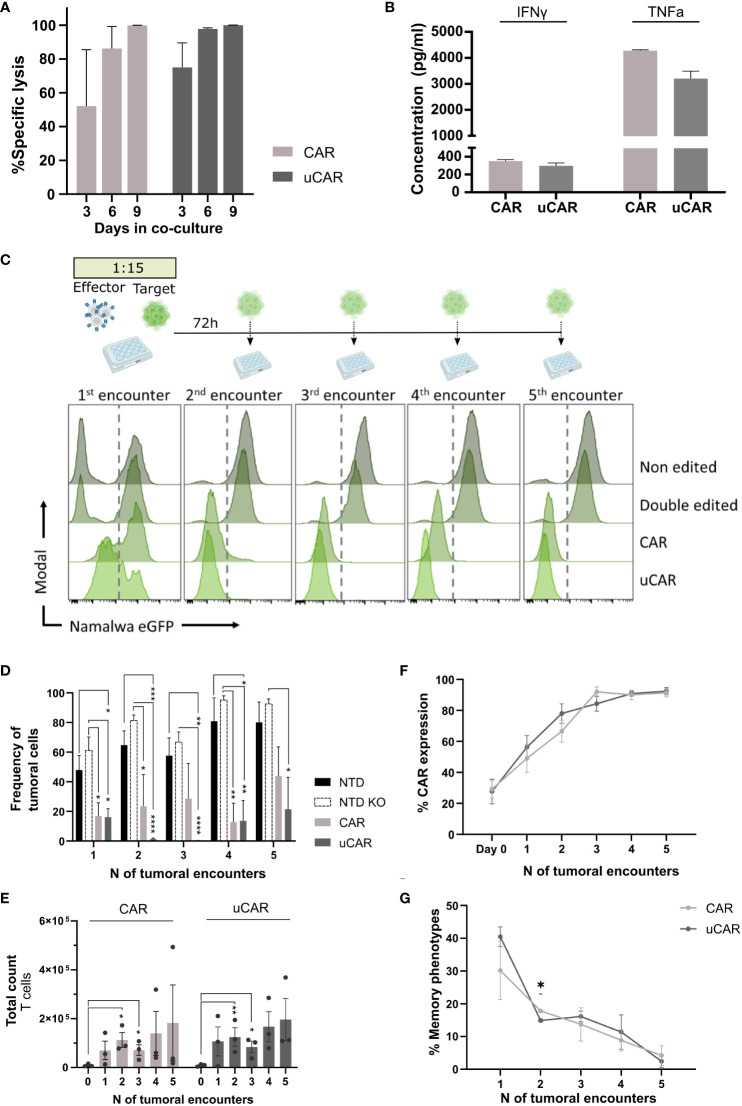
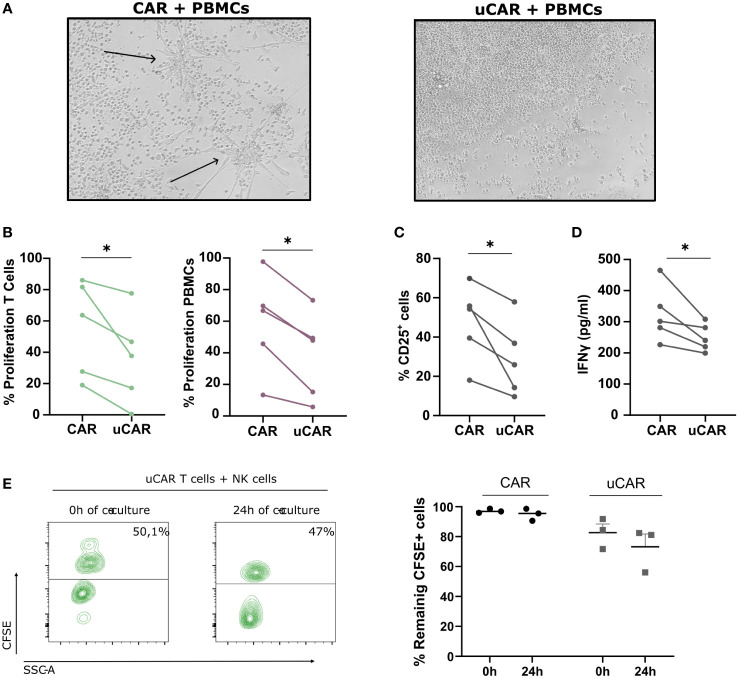
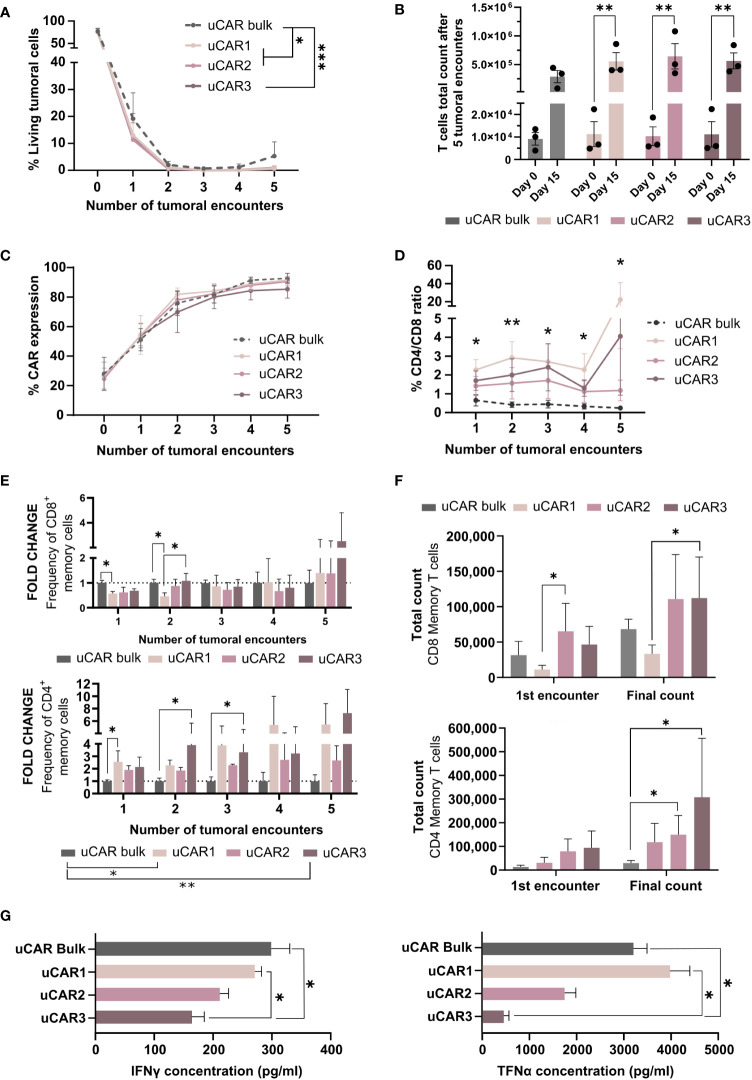
Results: In vitro experiments demonstrated the successful generation of functional universal CAR T cells. These cells exhibited potent lytic activity against tumor cells and a reduced cytokine secretion profile. The CRISPRroots analysis confirmed effective gene knockout and no unintended off-target effects, validating it as a pioneering tool for on/off-target and transcriptome analysis in genome editing experiments.

Discussion: Our findings establish a robust pipeline for manufacturing safe, universal CAR T cells with a favorable memory phenotype. This approach has the potential to address the current limitations of autologous CAR T cell therapy, offering a more stable and persistent treatment option with reduced adverse effects. The use of CRISPRroots enhances the reliability and safety of gene editing in the development of CAR T cell therapies.

Conclusion: We have developed a potent and reliable method for producing universal CAR T cells with a defined memory phenotype, demonstrating both efficacy and safety in vitro. This innovative approach could significantly improve the therapeutic landscape for patients with B cell malignancies.

Keywords: CRISPR/Cas9; CRISPRroots; allogeneic CAR-T cells; anti CD 19 CAR-T cells; memory CAR-T cells.


Conflict of interest statement

Authors MTM and PJL, were employed by LentiStem Biotech. The remaining authors declare that the research was conducted in the absence of any commercial or financial relationships that could be construed as a potential conflict of interest. The author(s) declared that they were an editorial board member of Frontiers, at the time of submission. This had no impact on the peer review process and the final decision.

Figures

Figure 1
Figure 1
Phenotypical characterization of T cells after edition showed no differences between unedited, edited and transduced T cells. (A) Ribonucleoparticle used for edition of T and CAR T cells. Two different sgRNAs were incubated with the Cas9 in order to form one complex targeting both loci. Created with BioRender.com. (B) In the left graph are represented CAR- (Non-transduced) and CAR+ (transduced) cells that did not present neither HLA-I nor CD3 in their surface. N=10. In the right graph, insertions and deletions (indels) generated in the target sites of the RNP. N=3. (C) Cytometry analysis of the different conditions, showing expression of HLA-I (x axis) and CD3 (y axis) in cells surface. The cytometry data presented herein are stochastic outcomes, reflecting the most reliable approximation of the underlying reality of the results. (D) Representation of the frequencies of the different T cells memory subsets (naïve, Tn; stem cell memory, Tscm; central memory, Tcm; and effector memory, Tem) and effector cells (Tef) 4 and 11 days after the edition was performed. Statistical differences were represented only between CAR and uCAR conditions, which we found of more importance. Sign * indicates differences between Tscm groups, and # indicates differences between Tef groups. N=3. (E) Graph showing frequency in cells of triple positive cells for the exhaustion markers PD1+, LAG3+ and TIM3. N=4. (F) Expression of activation induced cell death (AICD) markers (FasL, Fas, TRAIL) and annexin V in CAR and uCAR T cells. N=3; Friedman and Wilcoxon test were performed in comparisons. **p< 0.01. Non-significant results were not labelled in the graphs. *p<0.05, **p< 0.01, #p<0.05, ##p<0.01.
Figure 2
Figure 2
Safety analysis did not predict any important dysfunctional alterations directly caused due to simultaneous B2M/TRAC gene editing. (A) Workflow followed for the multiple safety analysis. (B) Graph showing alleles frequencies of different translocations found by ddPCR at day 7, 15 and 20 post editing. N=3. (C) Table showing the critical potential off-targets derived from the CRISPRroots analysis. ΔG_B represents binding energy obtained as in the model described in (Alkan et al., 2018). Binding energy model: ΔGB = δPAM(ΔGH − ΔGO − ΔGU), with ΔGH the RNA-DNA hybridization energy, weighted using positional weights measuring Cas9 influence, ΔGO the DNA-DNA binding energy, ΔGU the spacer RNA self-folding energy (minimum free energy), and δPAM is a PAM correcting factor. (D) Putative off-target sites described in the table were sequenced and INDELs were analyzed by ICE Synthego web tool. N=4. (E) Volcano plot showing differentially expressed genes (DEGs) in our double edited cells. The plot showcases the fold change of gene expression on the x-axis, with values indicating upregulation to the right and downregulation to the left. The statistical significance, represented as -log10 (p-value), is plotted on the y-axis. In this plot, genes that are downregulated in the double edited cells are highlighted in blue, while upregulated genes are shown in red. Genes with non-significant changes in expression are displayed in grey. In CRISPRroots DEGs are genes with average DESeq2 normalized reads > 10, absolute log2 fold change > 0.5, and Benjamini-Hochberg adjusted Wald test P-value< 0.05. While these thresholds attempt to maximize the recall of DEGs, for the overrepresentation analysis DEGs they were further filtered for absolute log2 fold change ≥ 2 to better isolate the most radical changes. (F) The figure illustrates the relationship between gene ratios and their associated functionalities within the dataset. The x-axis represents the gene ratios, which correspond to the fraction of differentially expressed genes among all expressed genes with a shared annotation, while the y-axis showcases the corresponding functional categories or annotations. Friedman test was performed in comparisons. *p< 0.05. Non-significant results were not labelled in the graphs.
Figure 3
Figure 3
Universal CAR T cells in co-culture with CD19+ tumoral cells act as non-edited CAR T cells. (A) Graph showing percentage of specific lysis of. CAR and uCAR. This parameter was calculated considering specificity when co-culturing tumoral cells with both CD19+ and CD19- cells and evaluating lysis in both cases. (B) ELISA-based quantification of IFN-γ and TNF-α secreted by effector cells after the first encounter with Namalwa cells. N=4. (C) Above.Timeline followed for cytotoxicity experiments. At day 0 tumoral cells are seeded with CAR T cells at ratio 15:1 respectively. Every 72h CAR T cells are rechallenged with tumoral cells. Below. Histograms resulting of cytometric analysis of the different co-culture wells showing presence of Namalwa CD19+ cells, tracked by FITC expression. In each histogram T cells can be tracked in the left and Namalwa in the right side (divided by a discontinuous line). (D) Graph representing frequency of tumoral cells in the different tumoral encounters. (E) T cells expansion, in terms of absolute numbers, over the tumoral rechallenges. (F) CAR expression in CAR and uCAR populations in co-culture with the tumoral cells. (G) Frequency of the sum of Tscm and Tcm after the different tumoral encounters; Friedman and Wilcoxon tests were performed. *p< 0.05, **p<0.01, ***p<0.001, ****p<0.0001. Non-significant results were not labelled in the graphs.
Figure 4
Figure 4
Alloreactivity Analysis of Universal CAR T Cells. (A) In a well with a 6-day co-culture 1:1 (T cells-PBMCs) no visible reaction is found using an optic microscope (10X). The arrows denote the differentiation signals of PBMCs visible to the naked eye. (B) When evaluating proliferation, based on CFSE and CTV dilution, we found a more resting state in wells where T cells did not present TCR nor HLA-I. N=5. (C) We measured by cytometry expression of the activation marker CD25+ in the total population and found similar results. N=5. (D) IFNγ liberation was measured by ELISA and represented as pg/ml. N=3. (E) Proportion of T cells (CFSE+) and NK cells (CFSE-) at initial (0h) and final point (24h) (left image). We represented frequency of remaining CFSE+ cells for both CAR and uCAR products. Data represented as fold change related to each donor. Wilcoxon tests were performed. *p< 0.05. No significant results were not labelled in the graphs.
Figure 5
Figure 5
Isolation and characterization of Memory Universal CAR T cells. (A) Experimental designed followed during the experiment. Phenotypic and functional characterization were performed after cell sorting at day 4. (B) Representation of the total count of each subset after sorter of CD3+ total bulk. (C) Subsets combinations were co-cultured as shown in the figure. uCAR T cells were enriched for Tscm phenotype (CD4/8+ CD45RA+) or for Tcm phenotype (CD4/8+ CD45RO+). Percentage of each gate are representative data from all evaluated donors. (D) Phenotypic characterization of T cell subsets performed by flow cytometry at day 0,2 and 7 post sorting, with ratio CD4:CD8 1:1 after separation. Data are represented as mean ± SEM of three independent healthy donors. N=3. Wilcoxon and Mann-Whitney T-test are shown. *p< 0.05, **p< 0.01, ****p< 0.0001. Non-significant results were not labelled in the graphs.
Figure 6
Figure 6
Cytolytic behavior of Memory Universal CAR T cells. (A) Graph showing frequency of living tumoral cells during several encounters, evaluated every 72h. (B) Representation of the T cells total expansion after five tumoral encounters. This data has been determined considering T cells count at each point in order to obtain the magnitude of the expansion. (C) CAR expression was measured by flow cytometry and represented as frequency in each well. (D) At each time point frequency of CD4/CD8 was evaluated by flow cytometry and represented for each set of cells as fold change related to day 0. (E) Representation of the summatory of Tscm and Tcm present in CD8+ (left) CD4+ (right) populations. Fold change related to uCAR population is represented. (F) Absolute numbers of memory T cells in each product. This data was obtained taking into account the frequency of Tscm and Tcm in each condition and T cells count in each condition. (G) IFN-γ (left) and TNF-α (right) cytokine quantification by ELISA assays, secreted by effector uCAR T cells after the first encounter with Namalwa cells. N=3; Friedman and Wilcoxon tests were performed. The legends show significance levels from ANOVA comparing group means overall. Specific significances at each time point are marked with asterisks directly on the graph. *p< 0.05, **p > 0.01, ***p > 0.001.

References

    1. Sterner RC, Sterner RM. CAR-T cell therapy: current limitations and potential strategies. Blood Cancer J. (2021) 11:69. doi: 10.1038/s41408-021-00459-7 - DOI - PMC - PubMed
    1. Huang R, Li X, He Y, Zhu W, Gao L, Liu Y, et al. . Recent advances in CAR-T cell engineering. J Hematol Oncol. (2020) 13:86. doi: 10.1186/s13045-020-00910-5 - DOI - PMC - PubMed
    1. Mohanty R, Chowdhury CR, Arega S, Sen P, Ganguly P, Ganguly N. CAR T cell therapy: A new era for cancer treatment (Review). Oncol Rep. (2019) 42:2183–95. doi: 10.3892/or.2019.7335 - DOI - PubMed
    1. June CH, Sadelain M. Chimeric antigen receptor therapy. N Engl J Med. (2018) 379:64–73. doi: 10.1056/NEJMra1706169 - DOI - PMC - PubMed
    1. Depil S, Duchateau P, Grupp SA, Mufti G, Poirot L. ‘Off-the-shelf’ allogeneic CAR T cells: development and challenges. Nat Rev Drug Discov. (2020) 19:185–99. doi: 10.1038/s41573-019-0051-2 - DOI - PubMed