Review
. 2024 Aug;11(30):e2401437.
doi: 10.1002/advs.202401437. Epub 2024 Jun 13.

Metal-Organic Frameworks in Surface Enhanced Raman Spectroscopy-Based Analysis of Volatile Organic Compounds

Affiliations
Review

Metal-Organic Frameworks in Surface Enhanced Raman Spectroscopy-Based Analysis of Volatile Organic Compounds

Juan A Allegretto et al. Adv Sci (Weinh). 2024 Aug.

Abstract

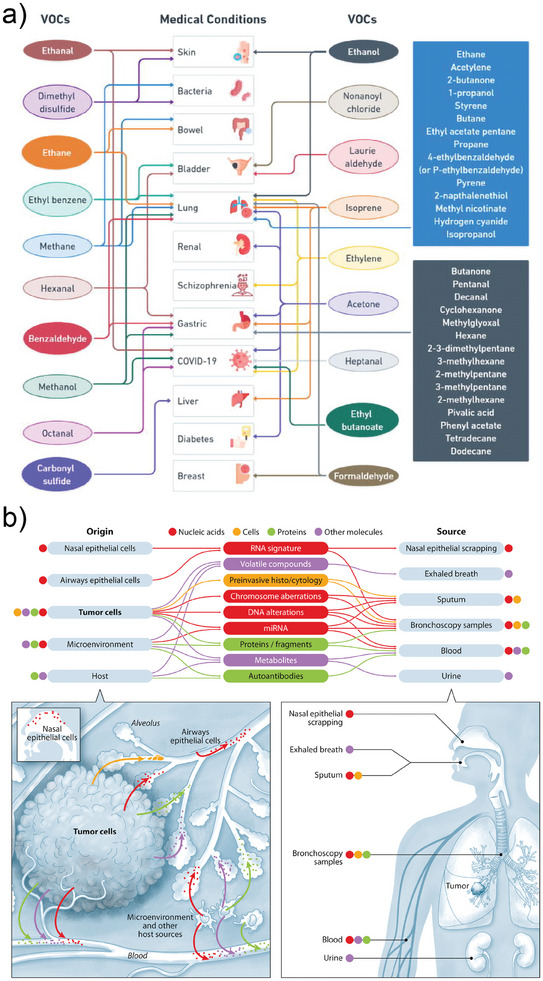
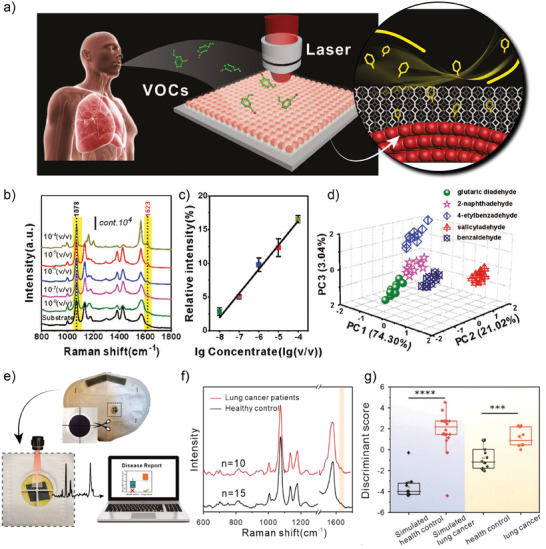
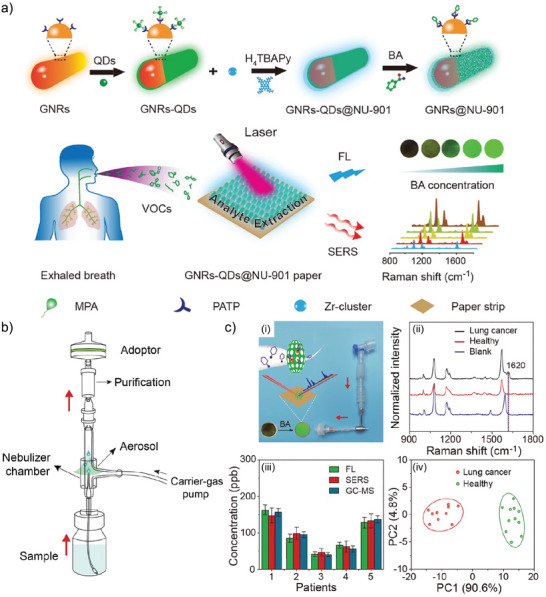
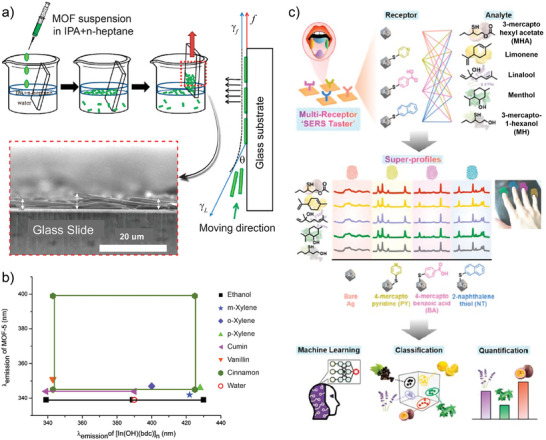
Volatile Organic Compounds (VOC) are a major class of environmental pollutants hazardous to human health, but also highly relevant in other fields including early disease diagnostics and organoleptic perception of aliments. Therefore, accurate analysis of VOC is essential, and a need for new analytical methods is witnessed for rapid on-site detection without complex sample preparation. Surface-Enhanced Raman Spectroscopy (SERS) offers a rapidly developing versatile analytical platform for the portable detection of chemical species. Nonetheless, the need for efficient docking of target analytes at the metallic surface significantly narrows the applicability of SERS. This limitation can be circumvented by interfacing the sensor surface with Metal-Organic Frameworks (MOF). These materials featuring chemical and structural versatility can efficiently pre-concentrate low molecular weight species such as VOC through their ordered porous structure. This review presents recent trends in the development of MOF-based SERS substrates with a focus on elucidating respective design rules for maximizing analytical performance. An overview of the status of the detection of harmful VOC is discussed in the context of industrial and environmental monitoring. In addition, a survey of the analysis of VOC biomarkers for medical diagnosis and emerging applications in aroma and flavor profiling is included.

Keywords: MOF; Raman; SERS; sensing; volatile organic compounds.


Conflict of interest statement

The authors declare no conflict of interest.

Figures

Figure 1
Figure 1
a) Schematic representation of dataset construction from search of specific keywords on Web of Science, curating, and data extraction process. b) Number of publications (not cumulative) on SERS, MOF, and the combination of both MOF and SERS together with milestone events. Full dataset is openly available at a repository.[ 49 ]
Figure 2
Figure 2
a) Schematics of the Raman scattering process. b) Examples of colloidal or solid substrates toward Surface‐Enhanced Raman Scattering (SERS) generated by (top) colloidal entities or (bottom) nanofabrication of plasmonic surfaces. c) Comparison of possible excitations (resonances) in a (left) metal‐molecule and (right) semiconductor‐molecule charge‐transfer complex for Chemical enhancement Mechanism.
Figure 3
Figure 3
a) Schematic representation of MOF, comparing their different building blocks and possible combinations for developing diverse structures, together with some relevant features. b) Schematic representation of chemical modification of MOF using UiO‐66 as example, where BDC linker can be modified with different dangling groups. c) Top‐10 of most employed MOF for SERS applications, as reflected in the dataset generated for this work.[ 49 ]
Figure 4
Figure 4
a) Schematic representation of the role of MOF on SERS substrates. b) Energy band matching for ZIF‐8 and ZIF‐67 MOF and two analytes: Rhodamine 6G (R6G) and Methyl Orange (MO) considering an excitation wavelength of 532 nm (values reported by Sun et al.[ 41 ]).
Figure 5
Figure 5
a) SEM images and schematics of the preparation of “films‐over‐nanospheres” (FON) based on ZIF‐8‐coated AgFON. b) Optimization of the FON structure for the LSPR to match laser excitation. Reproduced with permission from Kreno et al.[ 88 ] Copyright 2014, The Royal Society of Chemistry. c) Profile SEM images of Ag nanocubes assembled by Langmuir–Blodgett covered with ZIF‐8 films with different thicknesses. d) Optimization of ZIF‐8 thickness (as per growth cycles) of the SERS intensity for the detection of gaseous 4‐methylbenzenethiol (4‐MBT). Thickness estimated from reported data. Reproduced with permission from Koh et al.[ 94 ] Copyright 2018, The Royal Society of Chemistry. e) SEM and hyperspectral images and schemes for thickness optimization of the SERS substrates. Reproduced with permission from Phan‐Quang et al.[ 95 ] Copyright 2019, American Chemical Society. f) ‐ (i) Single core‐shell Au@MOF‐5 NPs with controllable shell thicknesses. (ii) CO2 detection capacity for the different MOF‐5 shell thicknesses. Reproduced with permission from He et al.[ 96 ] Copyright 2013, Wiley‐VCH Verlag GmbH & Co. KGaA. g) SERS response toward CO2 detection of Ag nanocubes encapsulated within ZIF‐8 and the different control experiments employing just a N2 flow, pre‐synthesized ZIF‐8 nanoparticles as modification for the Ag nanocubes and bare nanocubes assembly. Reproduced with permission from Lee et al.[ 100 ] Copyright 2017, American Chemical Society.
Figure 6
Figure 6
a) Prevalence of each type of substrate employed across literature. b) Enhancement factor as in Equation (1) for the two dominant types of substrates: cast particles and solid substrates. c) Analyte phase prevalence for SERS experiments and the associated d) incubation time (reported as optimized) required to reach constant signal. Data is openly available in a repository.[ 49 ]
Figure 7
Figure 7
a) ‐ (i) 3D reconstruction of Au/Ag@ZIF‐8 NPs and (ii) SERS spectra (black line: uncoated Au/Ag NPs; grey lines: Au/Ag@ZIF‐8) with their associated temporal evolution for the sensing of 4‐nitrobenzenethiol (NBT), 1‐naphtalenethiol (NAT), and Malachite Green Isothiocyanate (MGI). Reproduced with permission from Zheng et al.[ 115 ] Copyright 2016, Wiley‐VCH Verlag GmbH & Co. KGaA. b) ‐ (i) Outdoor remote sensing (Raman apparatus – target analyte distance of 2 m) of aerosolized Naphthalene and Toluene mixture, by tracking ii) characteristic peaks from toluene (δCH at 763 cm−1) and naphthalene (δCH at 786 cm−1) intensity ratio. Reproduced with permission from Phan‐Quang et al.[ 95 ] Copyright 2019, American Chemical Society. c) ‐ (i) TEM image of ZIF‐8 wrapped urchin‐like Au‐Ag nanocrystals (UAANs). (ii) Time evolution for the detection of γ‐hexachlorocyclohexane (γ‐HCH) for bare and wrapped UAANs and (iii) the associated linear range detection. Reproduced with permission from Zhou et al.[ 116 ] Copyright 2019, Elsevier Inc.
Figure 8
Figure 8
a) Schematic representation for the fabrication and regeneration of HKUST‐1@Ag* SERS substrate for the quali‐quantitative detection of PAHs. b) SERS spectra for the multivariate detection of VOC in (a) blank; b) river water; c) sewage water; d) seawater; e–g) spiked river, sewage, and seawater respectively. *Please note that the nomenclature here is used differently than previously mentioned, being Ag the outer layer of the composite. Reproduced with permission from Li et al.[ 119 ] Copyright 2019, The Royal Society of Chemistry.
Figure 9
Figure 9
a) Map of relevant VOC associated with different medical conditions. Reproduced with permission from Zhang et al.[ 123 ] Creative Commons CC BY 2023. b) Proposed biomarkers for Lung Cancer screening. Reproduced with permission from Seijo et al.[ 126 ] Copyright 2019, Elsevier Inc.
Figure 10
Figure 10
a) Schematic representation of aldehyde captures from exhaled breath for SERS detection. b) SERS spectra for 4‐ethylbenzaldehyde at different concentrations and c) the associated calibration curve. d) Principal Component Analysis (PCA) for the identification of several aldehydes. Reproduced with permission from Qiao et al.[ 132 ] Copyright 2017, Wiley‐VCH Verlag GmbH & Co. KGaA. e) Picture and schematic representation of facial mask utilization for collection of VOC from breath. f) SERS spectra (averaged) for healthy and lung cancer patients. g) PC‐LDA classifier based on SERS for simulated experiments (p < 0.0001) and real samples (p < 0.001). Reproduced with permission from Li et al.[ 133 ] Copyright 2022, Wiley‐VCH Verlag GmbH & Co. KGaA.
Figure 11
Figure 11
a) Schematic representation for the obtention of the GNRs‐QDs@NU‐901 dual SERS and Fluorescence substrates. MPA: 3‐mercaptopropionic acid; PATP: 4‐mercaptonoaniline; BA: Benzoic acid. b) Diagram of the nebulizer employed to convey the sample to the paper strip (dual sensor). c) ‐ (i) Photograph of breath collector and the scheme of the readout procedure after the interaction with the sample. (ii) SERS spectra for the different blank, healthy and lung cancer samples. (iii) Benchmarking of the dual fluorescence (FL) and SERS substrate against GC‐MS technique. Reproduced with permission from Xia et al.[ 135 ] Copyright 2021, American Chemical Society.
Figure 12
Figure 12
a) Schematic procedure for the synthesis of In(OH)(BDC) MOF crystals and their deposit on glass substrate by deep‐coating technique from water/n‐heptane interface, together with SEM lateral view. b) PCA readout of emission wavelength of analytes upon adsorption on In(OH)(BDC) and MOF‐5. Reproduced with permission from Lee et al.[ 142 ] Copyright 2011, American Chemical Society. c) Schematic representation behind the design and operation of multireceptor SERS taster for identification and quantification of wine flavor VOC. Reproduced with permission from Leong et al.[ 147 ] Copyright 2021, American Chemical Society.
Figure 13
Figure 13
a) Schematic representation of the odor intensity from kitchen waste autograding process, starting with the MOF‐based SERS substrate synthesis. b) ‐ (i) Picture of the odor collection approach, together with (ii) SERS spectra, (iii) peak intensities comparison, and (iv) PCA mapping for the different odor intensities. c) Schematic representation of the training of DL model employed for odor classification. Reproduced with permission from Yu et al.[ 148 ] Copyright 2022, American Chemical Society.

References

    1. Koppmann R., Volatile Organic Compounds in the Atmosphere, Wiley, New York: 2023.
    1. Balkhyour M. A., Chakroun R., Faidi F., Saudi J. Biol. Sci. 2023, 30, 103538. - PMC - PubMed
    1. Mohan S., Sruthy S., Environ. Process 2022, 9, 18.
    1. Giungato P., Gilio A. D., Palmisani J., Marzocca A., Mazzone A., Brattoli M., Giua R., de Gennaro G., TrAC Trends Anal. Chem. 2018, 107, 116.
    1. Nie E., Zheng G., Shao Z., Yang J., Chen T., Waste Manag 2018, 79, 188. - PubMed

LinkOut - more resources