. 2024 Aug;11(30):e2403516.
doi: 10.1002/advs.202403516. Epub 2024 Jun 13.

Dissecting Acute Drug-Induced Hepatotoxicity and Therapeutic Responses of Steatotic Liver Disease Using Primary Mouse Liver and Blood Cells in a Liver-On-A-Chip Model

Affiliations

Dissecting Acute Drug-Induced Hepatotoxicity and Therapeutic Responses of Steatotic Liver Disease Using Primary Mouse Liver and Blood Cells in a Liver-On-A-Chip Model

Hanyang Liu et al. Adv Sci (Weinh). 2024 Aug.

Abstract

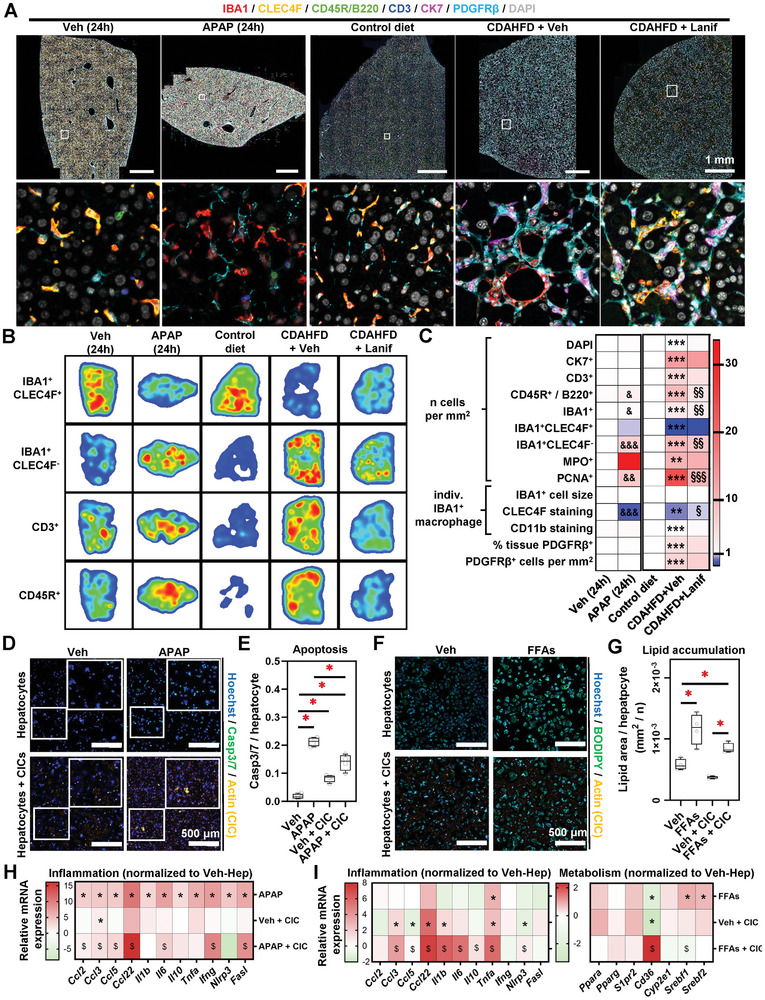
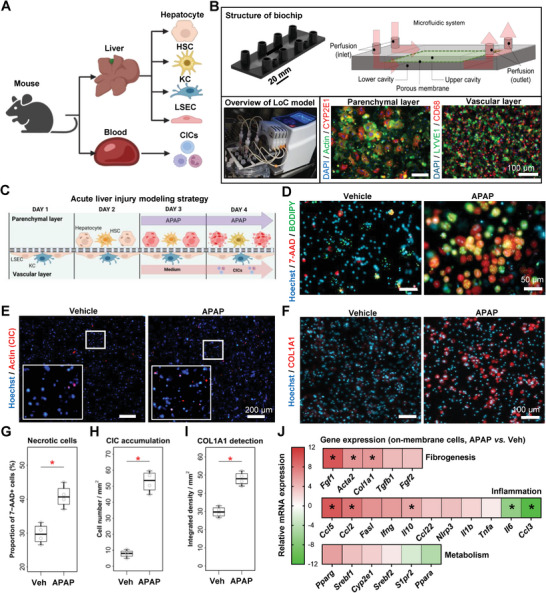
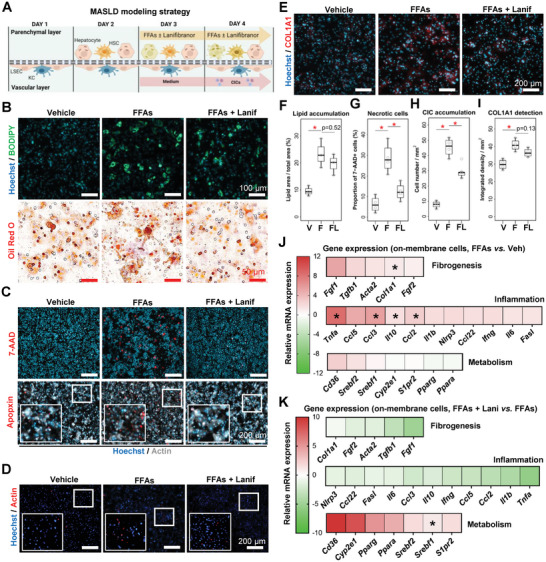
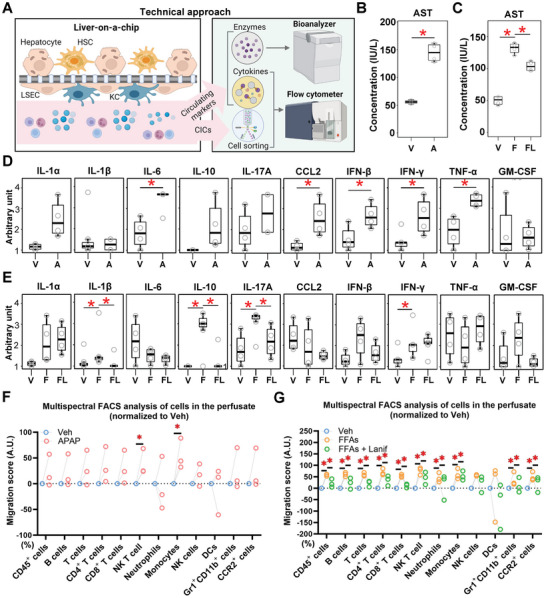
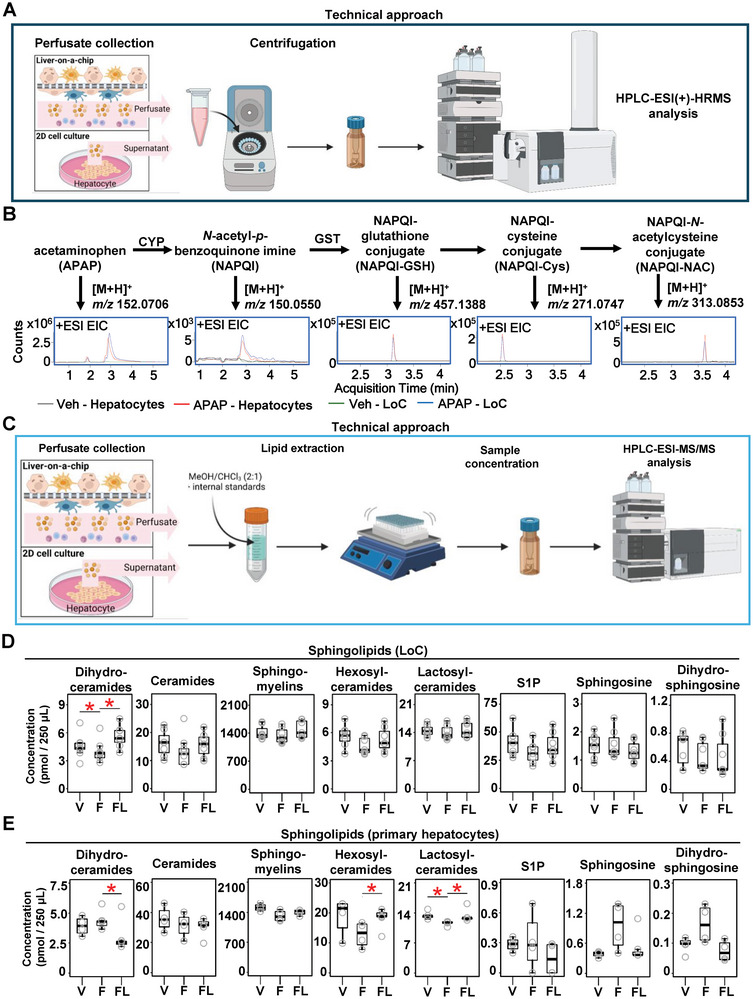
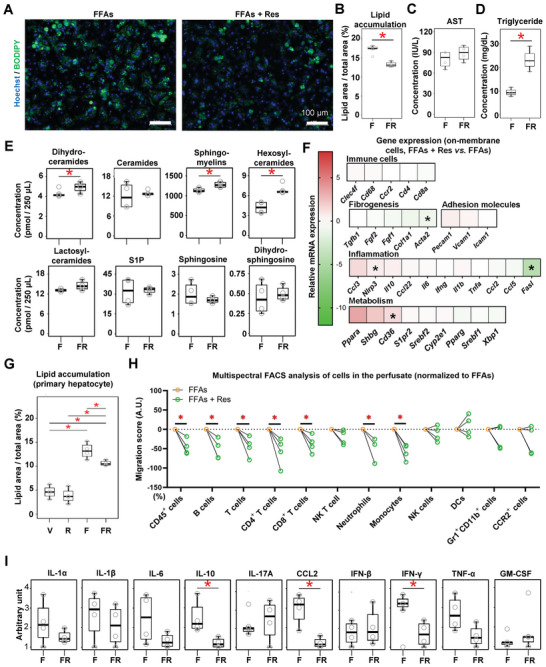
Metabolic dysfunction-associated steatotic liver disease (MASLD) is hallmarked by hepatic steatosis, cell injury, inflammation, and fibrosis. This study elaborates on a multicellular biochip-based liver sinusoid model to mimic MASLD pathomechanisms and investigate the therapeutic effects of drug candidates lanifibranor and resmetirom. Mouse liver primary hepatocytes, hepatic stellate cells, Kupffer cells, and endothelial cells are seeded in a dual-chamber biocompatible liver-on-a-chip (LoC). The LoC is then perfused with circulating immune cells (CICs). Acetaminophen (APAP) and free fatty acids (FFAs) treatment recapitulate acute drug-induced liver injury and MASLD, respectively. As a benchmark for the LoC, multiplex immunofluorescence on livers from APAP-injected and dietary MASLD-induced mice reveals characteristic changes on parenchymal and immune cell populations. APAP exposure induces cell death in the LoC, and increased inflammatory cytokine levels in the circulating perfusate. Under FFA stimulation, lipid accumulation, cellular damage, inflammatory secretome, and fibrogenesis are increased in the LoC, reflecting MASLD. Both injury conditions potentiate CIC migration from the perfusate to the LoC cellular layers. Lanifibranor prevents the onset of inflammation, while resmetirom decreases lipid accumulation in hepatocytes and increases the generation of FFA metabolites in the LoC. This study demonstrates the LoC potential for functional and molecular evaluation of liver disease drug candidates.

Keywords: NAFLD; NASH; fibrosis; liver diseases; macrophages; microfluidic biochip; steatohepatitis.


Conflict of interest statement

A.S.M. holds equity in and consults for Dynamic42 GmbH. FT's lab has received research funding from Allergan, Bristol‐Myers Squibb, Gilead and Inventiva. FT has received honoraria for consulting or lectures from Astra Zeneca, Gilead, AbbVie, BMS, Boehringer, Madrigal, MSD, GSK, Intercept, Falk, Ionis, Inventiva, Merz, Pfizer, Alnylam, NGM, CSL Behring, Novo Nordisk, Novartis. The other authors declare no conflict of interest.

Figures

Figure 1
Figure 1
Distinct circulating immune cells are mobilized to the liver and modulate hepatocyte responses to APAP and FFAs. A) Archival formalin‐fixed paraffin‐embedded mouse liver samples were retrieved and subjected to multiplex immunohistochemistry. B) Digital image segmentation and analysis were performed. Heatmaps represent immune cell location in the respective mouse models. C) Imaging cytometry allowed for immune and pathology‐associated cell numbering, and individual cell staining intensity measurements. Individual data points are displayed in Figures S1D,  S2D (Supporting Information. D–I) Conventional 2D cell culture was performed using primary mouse hepatocytes and CICs, exposed to either APAP or FFAs. D) Immunocytochemistry was performed to visualize cell death. Quantification is shown in (E). F) Cells were cultured in the presence of FFAs and BODIPY staining was applied to visualize lipid deposition. G) BODIPY quantitation. H,I) Relative gene expression was analyzed by qRT‐PCR. Sample sizes: A–C) n(Veh) = 4, n(APAP) = 4, n(control diet) = 4, n(CDAHFD + Veh) = 7, n(CDAHFD + Lanif) = 7. D–I) n = 4 per group. Abbreviations: APAP: acetaminophen; CDAHFD: choline‐deficient, amino acid‐defined high‐fat diet; Lanif: lanifibranor; Veh: vehicle; CK7: cytokeratin 7; CD3: a cluster of differentiation 3; CD45R: cluster of differentiation 45 receptor; IBA1: Ionized calcium‐binding adaptor molecule 1; Ccl: Chemokine (C‐C motif) ligand; CLEC4F: C‐Type Lectin Domain Family 4 Member F; MPO: myeloperoxidase; PCNA: proliferating cell nuclear antigen; CD11b: cluster of differentiation 11b; PDGFRβ: platelet‐derived growth factor receptor beta. C) One‐way ANOVA followed by Tukey's multiple comparison was performed. &p < 0.05; &&< 0.01; &&&< 0.005 as compared to vehicle; **< 0.01; ***< 0.005 as compared to control diet; §< 0.05; §§< 0.01; §§§< 0.005 as compared to CDAHFD + vehicle. E,G,H,I) One‐way ANOVA followed by Tukey's multiple comparison test was performed. H, I) *< 0.05 as compared to a vehicle; $< 0.05 as compared to Veh + CIC.
Figure 2
Figure 2
Designing and validating a microfluidically perfused LoC for acute liver injury modeling. A) Schematic view of the liver and circulating cells isolated prior to LoC seeding. B) LoC set‐up depicting liver cell organization into the LoC during CIC perfusion. The upper image depicts the biochip used in this model. The lower left photograph shows the experimental set‐up within the cell culture incubator, including a peristaltic pump. The lower right microscopy images show the two layers of cells, staining by immunocytochemistry for the indicated markers. C) Experimental outline of the acute APAP injury model in the LoC. Fluorescence microscopy was used to visualize D) cell death (parenchymal layer), E) labeled CIC attachment to the membrane (vascular layer), and F) collagen 1A1 expression (parenchymal layer); quantitation is shown in (G–I), respectively. J) Total mRNA was extracted from the membrane at the end of the experiments, and gene expression was analyzed. Data shows the relative gene expression in APAP‐treated LoC as compared to vehicle. Individual points are depicted in Figure 5A–C (Supporting Information). Sample sizes: B–J) n = 4 per group. Abbreviations: APAP: acetaminophen; CICs: circulating immune cells; Ccl: Chemokine (C‐C motif) ligand; COL1A1: collagen, type I, alpha 1; GM‐CSF: granulocyte‐macrophage colony‐stimulating factor; HSC: hepatic stellate cell; IL: interleukin; IFN: interferon; KC: Kupffer cell; LSEC: liver sinusoidal endothelial cell; Tnfa: tumor necrosis factor‐alpha; Veh: vehicle. Paired student's t‐tests were performed. *< 0.05 as compared to vehicle.
Figure 3
Figure 3
The LoC for modeling key features of MASLD and therapeutic effects of lanifibranor. A) Experimental outline of the FFA‐induced MASLD model in the LoC. B) Lipid vesicle accumulation in LoC hepatocytes was verified by BODIPY and Oil Red O staining. C) Cell death was visualized by 7‐AAD and Apopxin staining, D) immune cell recruitment by using reporter CICs, and E) collagen accumulation by immunostaining. B–E) Parenchymal layer. F–I) Staining quantitation from the staining displayed in panels (B–E). Relative gene expression was assessed from the LoC membrane, and is displayed either as J) FFA‐treated relative to vehicle, or K) FFA plus lanifibranor relative to FFA plus vehicle. Individual points are depicted in Figure S7A–C (Supporting Information). Sample sizes: B–K) n = 4 per group. Abbreviations: COL1A1: collagen, type I, alpha 1; CICs: circulating immune cells; F or FFA: free‐fatty acid treated; FL or FFAs + Lanif: free fatty acid plus lanifibranor; V or Veh: vehicle. Paired student's t‐tests were performed. *< 0.05 as indicated or as compared to vehicle.
Figure 4
Figure 4
Lanifibranor treatment reduces hepatocyte injury, inflammatory cytokine, and circulating immune cell recruitment in the LoC. A) Wild‐type CICs were perfused for 30 min into the LoC after APAP‐, FFA‐, or FFA and lanifibranor treatment, and the remaining cells from the perfusate were analyzed by multispectral flow cytometry. The dynamically perfused culture medium may be collected at the end of the experiment and used for further measurements including cytokine and transaminase measurement. AST activity was measured in the LoC exposed to B) acetaminophen, or C) FFAs and lanifibranor. Circulating cytokine levels measured in the perfusate from the LoC exposed to D) acetaminophen, or E) FFAs and lanifibranor. CIC depletion (migration score) from the LoC perfusate after F) APAP or G) FFA with or without lanifibranor treatment is shown for the respective immune cell types. Relative changes in absolute cell numbers as compared to the appropriate vehicle conditions. Sample sizes: B–E) n = 4 per group, F,G) n = 3 per group. Abbreviations: A or APAP: acetaminophen; AST: aspartate aminotransferase; CCL2: Chemokine (C‐C motif) ligand 2; CICs: circulating immune cells; DCs: dendritic cells; F or FFAs: free fatty acids; FL or FFAs + Lanif: free fatty acids plus lanifibranor; FACS: fluorescence‐activated cell sorting; GM‐CSF: granulocyte‐macrophage colony‐stimulating factor; HSCs: hepatic stellate cells; IFN: interferon; IL: interleukin; IU: international units; KCs: Kupffer cells; LSECs: liver sinusoidal endothelial cells; NK: natural killer; TNF‐α: tumor necrosis factor‐alpha; V or Veh: vehicle. One‐way ANOVA followed by Tukey's multiple comparison test and paired student's t‐tests were performed. *< 0.05 as indicated or as compared to vehicle.
Figure 5
Figure 5
Lanifibranor moderately affects sphingolipid metabolism and release in vitro. A) HPLC‐ESI(+)‐HRMS was used to measure APAP metabolites on B) 2D hepatocyte culture and LoC. C) HPLC‐ESI‐MS/MS was used to measure FFA metabolites. Sphingolipids were measured on D) LoC perfusate, and E) conventional primary hepatocyte culture supernatant. Sample sizes: B,D,E) n = 4 per group. Abbreviations: APAP: acetaminophen; CYP: cytochrome P450; EIC: extracted ion chromatogram; F: free‐fatty acid treated; FL: free fatty acids plus lanifibranor treated; GST: glutathione S‐transferase; HPLC‐ESI‐HRMS: high‐performance liquid chromatography‐electrospray ionization high‐resolution mass spectrometry; HPLC‐ESI‐MS/MS: high‐performance liquid chromatography‐electrospray ionization tandem‐mass spectrometry; S1P: sphingosine‐1‐phosphate; V: vehicle. Paired student's t‐tests were performed. *< 0.05 as indicated or as compared to vehicle.
Figure 6
Figure 6
Therapeutic effects of resmetirom on metabolism, inflammation and fibrogenesis in the MASLD‐LoC model. Liver cells were seeded in the LoC as shown in Figure 3A, but using resmetirom instead of lanifibranor. CICs were only perfused for the last 30 min of the experiment. A) BODIPY was used to measure lipid vesicle accumulation in the parenchymal layer, and quantitation is displayed in (B). C) AST activity and D) triglyceride levels were measured in the LoC perfusate with a Bioanalyzer. E) FFA metabolites from the LoC perfusate were analyzed by HPLC‐ESI‐MS/MS. F) Gene expression analysis of the LoC treated with resmetirom or vehicle, shown as relative expression to FFA‐treated LoC. Individual points are depicted in Figure 12D,F,G,I,J (Supporting Information). G) Lipid accumulation was measured in conventional cell culture supernatant of primary hepatocytes exposed to resmetirom, by using BODIY. H) Multispectral flow cytometry was performed to estimate CIC migration to the LoC. I) Circulating cytokine levels in the LoC perfusate were assessed. Sample sizes: n = 4 per group. Abbreviations: AST: aspartate aminotransferase; CCL2: Chemokine (C‐C motif) ligand 2; CICs: circulating immune cells; DCs: dendritic cells; F or FFAs: free fatty acids; FR or FFAs + Res: free fatty acids plus resmetirom; NK: natural killer; IL: interleukin; IFN: interferon; S1P: sphingosine‐1‐phosphate; TNF‐α: tumor necrosis factor‐alpha; GM‐CSF: granulocyte‐macrophage colony‐stimulating factor. One‐way ANOVA followed by Tukey's multiple comparison test and un‐/paired student's t‐tests were performed. *< 0.05 as indicated.

References

    1. Lazarus J. V., Mark H. E., Allen A. M., Arab J. P., Carrieri P., Noureddin M., Alazawi W., Alkhouri N., Alqahtani S. A., Anstee Q. M., Arrese M., Bataller R., Berg T., Brennan P. N., Burra P., Castro‐Narro G. E., Cortez‐Pinto H., Cusi K., Dedes N., Duseja A., Francque S. M., Gastaldelli A., Hagstrom H., Huang T. T. K., Ivancovsky Wajcman D., Kautz A., Kopka C. J., Krag A., Newsome P. N., Rinella M. E., et al., Hepatology. 2023, 79, 502. - PMC - PubMed
    1. Rinella M. E., Lazarus J. V., Ratziu V., Francque S. M., Sanyal A. J., Kanwal F., Romero D., Abdelmalek M. F., Anstee Q. M., Arab J. P., Arrese M., Bataller R., Beuers U., Boursier J., Bugianesi E., Byrne C., Castro Narro G. E., Chowdhury A., Cortez‐Pinto H., Cryer D., Cusi K., El‐Kassas M., Klein S., Eskridge W., Fan J., Gawrieh S., Guy C. D., Harrison S. A., Kim S. U., Koot B., et al., J Hepatol. 2023, 79, 1542. - PubMed
    1. Mitten E. K., Baffy G., J. Hepatol. 2022, 77, 1642. - PubMed
    1. Powell E. E., Wong V. W., Rinella M., Lancet. 2021, 397, 2212. - PubMed
    1. Tacke F., Puengel T., Loomba R., Friedman S. L., J. Hepatol. 2023, 79, 552. - PubMed

Substances

LinkOut - more resources