Sulforaphane enhanced muscle growth by promoting lipid oxidation through modulating key signaling pathways
- PMID: 38868980
- PMCID: PMC11224001
- DOI: 10.1042/BSR20240084
Sulforaphane enhanced muscle growth by promoting lipid oxidation through modulating key signaling pathways
Abstract
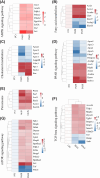
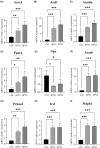
Sulforaphane (SFN) has shown diverse effects on human health and diseases. SFN was administered daily to C57BL/6J mice at doses of 1 mg/kg (SFN1) and 3 mg/kg (SFN3) for 8 weeks. Both doses of SFN accelerated body weight increment. The cross-sectional area and diameter of Longissimus dorsi (LD) muscle fibers were enlarged in SFN3 group. Triglyceride (TG) and total cholesterol (TC) levels in LD muscle were decreased in SFN groups. RNA sequencing results revealed that 2455 and 2318 differentially expressed genes (DEGs) were found in SFN1 and SFN3 groups, respectively. Based on GO enrichment analysis, 754 and 911 enriched GO terms in the SFN1 and SFN3 groups, respectively. KEGG enrichment analysis shown that one KEGG pathway was enriched in the SFN1 group, while six KEGG pathways were enriched in the SFN3 group. The expressions of nine selected DEGs validated with qRT-PCR were in line with the RNA sequencing data. Furthermore, SFN treatment influenced lipid and protein metabolism related pathways including AMPK signaling, fatty acid metabolism signaling, cholesterol metabolism signalling, PPAR signaling, peroxisome signaling, TGFβ signaling, and mTOR signaling. In summary, SFN elevated muscle fibers size and reduced TG and TC content of in LD muscle by modulating protein and lipid metabolism-related signaling pathways.
Keywords: Sulforaphane; fiber size; lipid; metabolism; muscle growth; protein.
© 2024 The Author(s).
Conflict of interest statement
The authors declare that there are no competing interests associated with the manuscript.
Figures


Similar articles
-
Anti-obesity effect of sulforaphane in broccoli leaf extract on 3T3-L1 adipocytes and ob/ob mice.J Nutr Biochem. 2022 Feb;100:108885. doi: 10.1016/j.jnutbio.2021.108885. Epub 2021 Oct 13. J Nutr Biochem. 2022. PMID: 34655754
-
Sulforaphane Attenuates Nonalcoholic Fatty Liver Disease by Inhibiting Hepatic Steatosis and Apoptosis.Nutrients. 2021 Dec 24;14(1):76. doi: 10.3390/nu14010076. Nutrients. 2021. PMID: 35010950 Free PMC article.
-
Sulforaphane ameliorates non-alcoholic fatty liver disease in mice by promoting FGF21/FGFR1 signaling pathway.Acta Pharmacol Sin. 2022 Jun;43(6):1473-1483. doi: 10.1038/s41401-021-00786-2. Epub 2021 Oct 15. Acta Pharmacol Sin. 2022. PMID: 34654875 Free PMC article.
-
Protective role of sulforaphane in lipid metabolism-related diseases.Mol Biol Rep. 2025 Feb 17;52(1):241. doi: 10.1007/s11033-025-10358-w. Mol Biol Rep. 2025. PMID: 39961997 Review.
-
Sulforaphane ameliorates lipid profile in rodents: an updated systematic review and meta-analysis.Sci Rep. 2021 Apr 8;11(1):7804. doi: 10.1038/s41598-021-87367-9. Sci Rep. 2021. PMID: 33833347 Free PMC article.
Cited by
-
Comprehensive profiling of chemokine and NETosis-associated genes in sarcopenia: construction of a machine learning-based diagnostic nomogram.Front Med (Lausanne). 2025 Jun 23;12:1606430. doi: 10.3389/fmed.2025.1606430. eCollection 2025. Front Med (Lausanne). 2025. PMID: 40625358 Free PMC article.
References
Publication types
MeSH terms
Substances
Grants and funding
- Nr.1679/High level Talent Program of Sichuan Province
- CARS-43/the earmarked fund
- scsztd-2023-08-07/National Modern Agricultural Industrial Technology System, Sichuan Innovation Team
- 2023YFN0056/Sichuan Provincial Science and Technology Plan Program
- 22ZDYF0249/Liangshan Science and Technology Plan Program
LinkOut - more resources
Full Text Sources
Research Materials
Miscellaneous

