. 2024 Aug 12;52(14):8241-8253.
doi: 10.1093/nar/gkae506.

Staphylococcal aconitase expression during iron deficiency is controlled by an sRNA-driven feedforward loop and moonlighting activity

Affiliations

Staphylococcal aconitase expression during iron deficiency is controlled by an sRNA-driven feedforward loop and moonlighting activity

Maxime Barrault et al. Nucleic Acids Res. .

Abstract

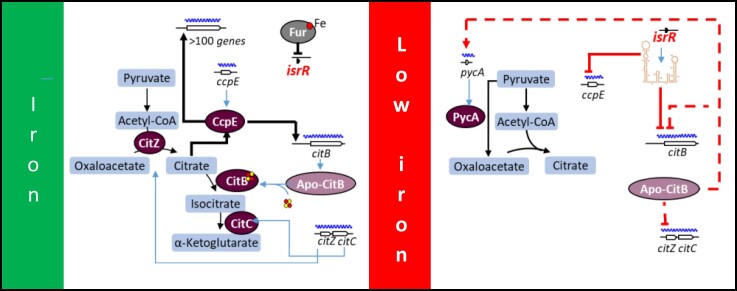
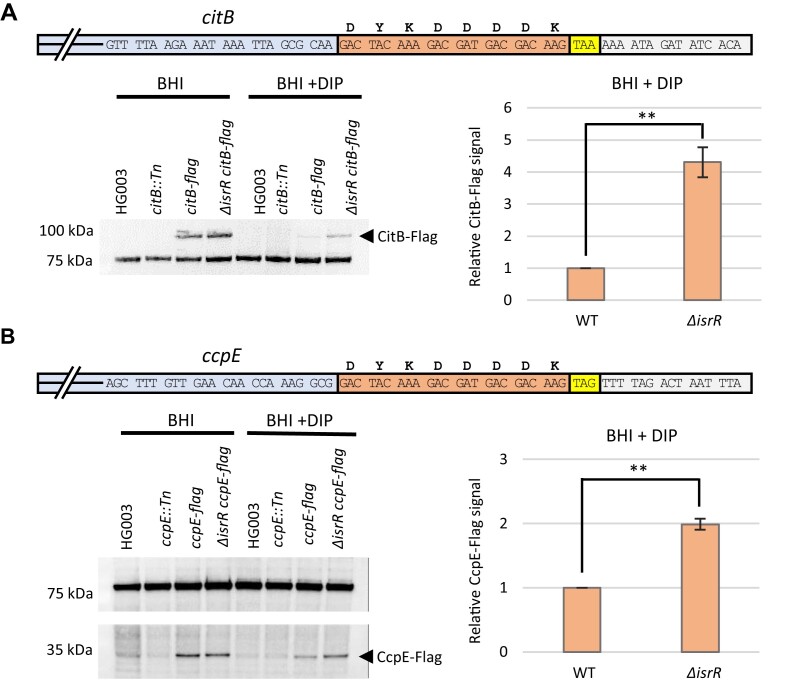
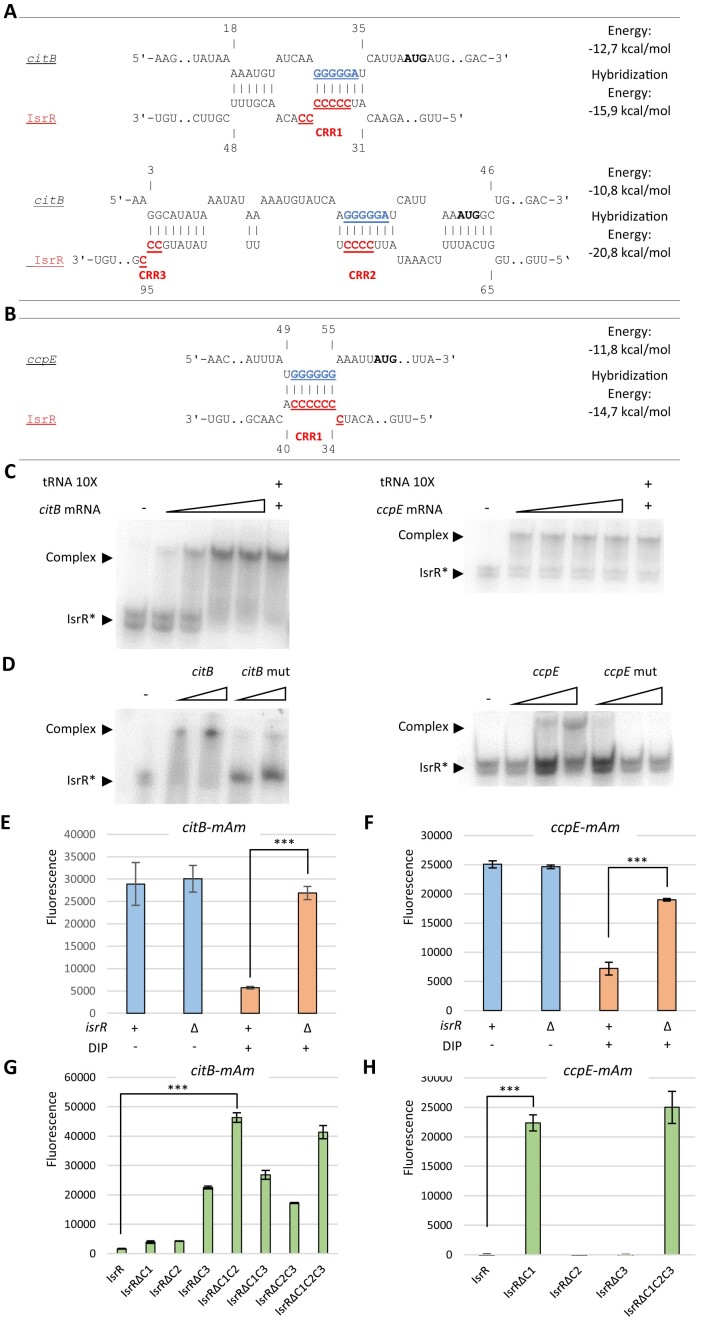
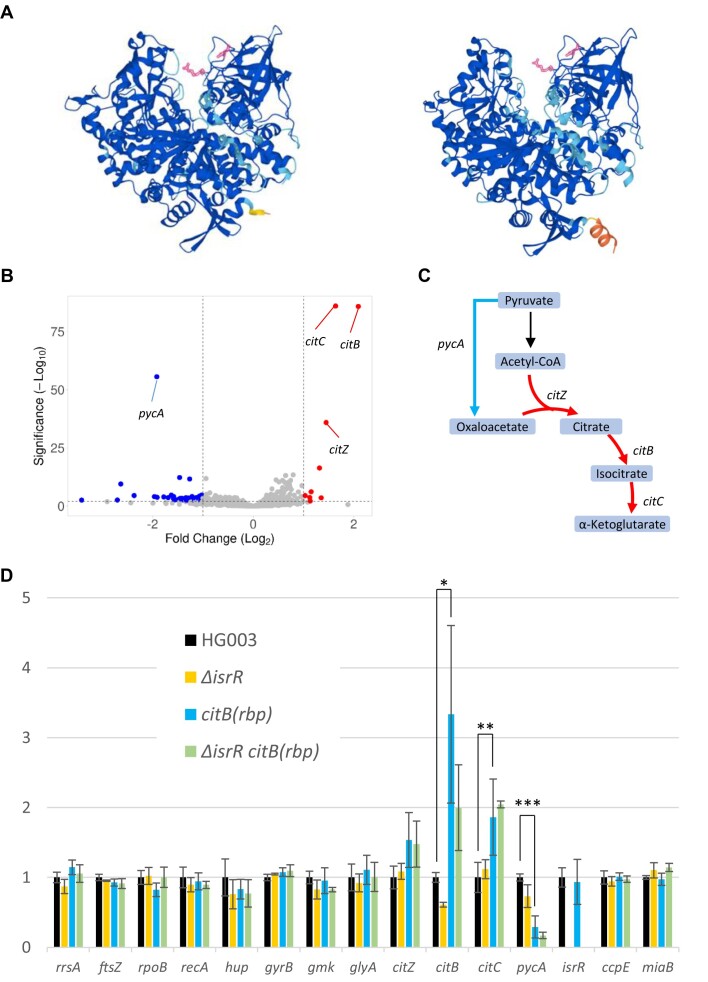
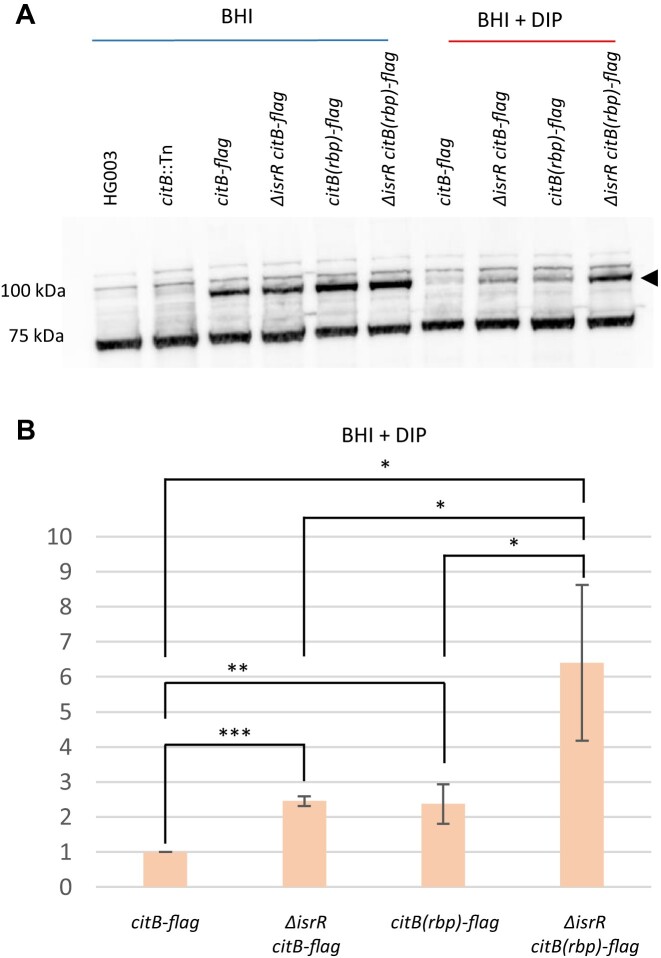
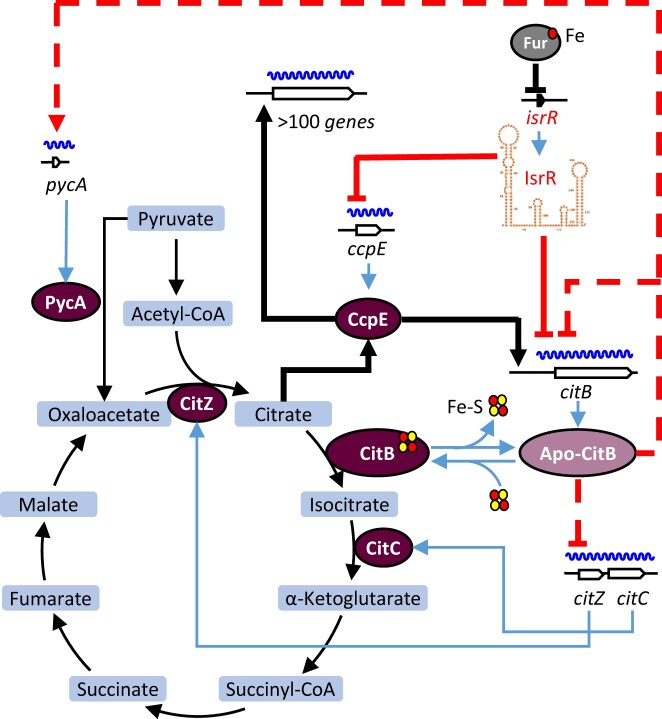
Pathogenic bacteria employ complex systems to cope with metal ion shortage conditions and propagate in the host. IsrR is a regulatory RNA (sRNA) whose activity is decisive for optimum Staphylococcus aureus fitness upon iron starvation and for full virulence. IsrR down-regulates several genes encoding iron-containing enzymes to spare iron for essential processes. Here, we report that IsrR regulates the tricarboxylic acid (TCA) cycle by controlling aconitase (CitB), an iron-sulfur cluster-containing enzyme, and its transcriptional regulator, CcpE. This IsrR-dependent dual-regulatory mechanism provides an RNA-driven feedforward loop, underscoring the tight control required to prevent aconitase expression. Beyond its canonical enzymatic role, aconitase becomes an RNA-binding protein with regulatory activity in iron-deprived conditions, a feature that is conserved in S. aureus. Aconitase not only negatively regulates its own expression, but also impacts the enzymes involved in both its substrate supply and product utilization. This moonlighting activity concurrently upregulates pyruvate carboxylase expression, allowing it to compensate for the TCA cycle deficiency associated with iron scarcity. These results highlight the cascade of complex posttranscriptional regulations controlling S. aureus central metabolism in response to iron deficiency.


Figures

Graphical Abstract
Graphical Abstract
Figure 1.
Figure 1.
IsrR downregulates the production of CitB and CcpE. (A) Upper part: schematic representation of the CitB-Flag reporter fusion. Blue, 3′ end of citB ORF; red, Flag sequence; yellow, native stop codon; grey, first nts of mRNA 3′UTR. Below left: western-blot experiment with anti-Flag antibodies. Genotypes and growth conditions are indicated. 100 kDa, signals corresponding to CitB-Flag; 75 kDa, non-specific signal present in all samples including Flag-less strains. The 75 kDa signal was used as a loading control for normalization. Below right: Histograms, relative quantity of CitB-FLAG in HG003 (WT) and ΔisrR strains grown in iron-sequestered medium (N = 3). Each specific FLAG intensity signal was normalized to the 75kDa non-specific signal and set to one for the WT strain. (B) Upper part: schematic representation of the CcpE-Flag reporter fusion as in Figure 1A, except blue corresponds to the 3′ end of cppE ORF. Below left, Western-blot experiment showing the production of the CcpE-Flag as in Figure 1A except that the CcpE-Flag band is at 35 kDa. Note a weak non-specific signal at 35kDa is also present in Flag-less strains. Below right: Histograms, relative quantity of CcpE-FLAG in HG003 (WT) and ΔisrR strains grown in iron-sequestered medium (N = 3). Quantification as in (A).
Figure 2.
Figure 2.
Translational repression of citB and ccpE reporters by IsrR. (A) IntaRNA (18) pairing prediction between IsrR and citB mRNA, and (B) between IsrR and ccpE mRNA. For (A) and (B) Underline blue sequences, SD; underline red sequences, CRRs; bold black characters, AUG start codon. (C) Complex formation between IsrR and the citB and ccpE mRNAs. Native gel retardation assays of purified labeled IsrR with increasing amounts of either unlabeled citB mRNA, ccpE mRNA or a 10-fold excess of unlabeled synthetic RNA from E. coli. (D) Analysis of complex formation between IsrR with citB and ccpE mRNAs or mutated version of these mRNA targets. For sequences of RNAs generated for EMSAs, see Supplementary Table S4. (E) citB-mAm gene expression in BHI and BHI supplemented with DIP broths. The fluorescence of overnight cultures of HG003 and HG003 ΔisrR derivatives harboring the fusion was determined using a microplate reader (arbitrary units). Sample fluorescence was normalized to their OD600 (N = 3). (F) ccpE-mAm gene expression in BHI and BHI supplemented with DIP broths. Same conditions as (E). (G) Contribution of IsrR CRRs in citB regulation. The ΔisrR strain harboring the citB-mAm reporter fusion was transformed with plasmids expressing different versions of IsrR and cultured in liquid in BHI supplemented with DIP. The translational activity of the citB-mAm reporter fusion was quantified by measuring the fluorescence of each strain on a microplate reader (arbitrary units). Sample fluorescence was normalized to their OD600 (N = 3). (H) Contribution of IsrR in ccpE regulation. The ΔisrR strain harboring the ccpE-mAm reporter fusion was transformed with plasmids expressing different versions of IsrR and cultured overnight in BHI supplemented with DIP. The translational activity of the ccpE-mAm reporter fusion was quantified by measuring the fluorescence (arbitrary units) of each strain on a microplate reader. Sample fluorescence was normalized to their OD600 (N = 3).
Figure 3.
Figure 3.
RNAs significantly affected by aconitase RBP activity. (A) AlphaFold structures of aconitases from S. aureus (left) and B. subtilis (right) (51). AlphaFold produces a per-residue model confidence score (pLDDT) between 0 and 100: dark blue, very high (pLDDT > 90); light blue, high (90 > pLDDT > 70); yellow, low (70 > pLDDT > 50); orange, very low (pLDDT < 50). The arginine and glutamine required for the RBP activity are shown in red. (B) Volcano plot showing the relevant differences in gene expression between HG003 and citB(rbp) derivative upon iron starvation. The two strains were cultured overnight, followed by resuspension in fresh BHI medium supplemented with DIP. Samples were collected at an OD600 of 1 and RNA was extracted. Subsequently, Illumina RNA sequencing was performed, and the resulting data were analyzed using DEseq2 software. Genes with reduced expression in the citB(rbp) strain are shown in blue, while those with increased expression are displayed in red. Colored spots correspond to genes with a fold-change <0.5 or >2, a significance level with a P-adjusted value below 0.005. The analysis includes the genes with a minimum of 20 reads across at least one condition (N = 3). (C) Metabolic regulations mediated by apo-CitB according to transcriptomic data. Red arrows, genes downregulated by apo-CitB; blue arrow, gene activated by apo-CitB; PEP, phosphoenolpyruvate; Asp, aspartate; Lys, lysine; Asn, asparagine; Thr, threonine. (D) Quantification of selected RNAs in the indicated strains relative to HG003 by qRT-PCR.
Figure 4.
Figure 4.
CitB RBP activity and IsrR-dependent citB regulation. (A) Western-blot experiment with anti-Flag antibodies. Genotypes and growth conditions are indicated. Signals at about 100 kDa that are not present in the HG003 and HG003 citB::Tn strains correspond to CitB-Flag; 75 kDa, non-specific signal present in all samples including Flag-less strains. The 75 kDa non-specific signal was used as a loading control. (B) Histograms of CitB-Flag and CitB(RBP)-Flag signals in BHI DIP normalized to their corresponding 75 kDa signal (N = 3).
Figure 5.
Figure 5.
IsrR and apo-CitB controlled citrate metabolism upon iron starvation. Under iron-replete conditions, the transcription of isrR is repressed by Fur bound by Fe2+ (or Fe–S clusters (77)). Iron starvation leads to the alleviation of Fur repression, resulting in the expression of isrR (6). IsrR exerts its regulatory control on citrate metabolism by downregulating citB expression. This downregulation occurs through two distinct mechanisms: direct inhibition of citB mRNA translation and indirectly via inhibition of ccpE mRNA translation, CcpE being a transcriptional activator of citB and over a hundred other genes. Concomitantly, as iron being scarce, aconitase undergoes a transition from its Fe–S cluster-bound form to apo-CitB, a regulatory RNA-binding protein. Apo-CitB plays a pivotal role in the modulation of TCA cycle, leading to the downregulation of citZ-citC mRNA levels and its mRNA expression, while simultaneously promoting an increase in pycA mRNA levels, encoding pyruvate carboxylase. Red line, regulation associated with iron starvation uncovered by this study (dashed line, possible indirect regulations); blue line, transcriptions, translations or enzyme modification; thin black line, metabolic pathways; thick black line, CcpE activation or associated regulations; red disk, iron; yellow disk, sulfur.

Similar articles

Cited by

References

    1. Murdoch C.C., Skaar E.P.. Nutritional immunity: the battle for nutrient metals at the host-pathogen interface. Nat. Rev. Microbiol. 2022; 20:657–670. - PMC - PubMed
    1. Troxell B., Hassan H.M.. Transcriptional regulation by Ferric Uptake Regulator (Fur) in pathogenic bacteria. Front. Cell. Infect. Microbiol. 2013; 3:59. - PMC - PubMed
    1. Pinochet-Barros A., Helmann J.D.. Redox sensing by Fe(2+) in bacterial fur Family metalloregulators. Antioxid. Redox Signaling. 2018; 29:1858–1871. - PMC - PubMed
    1. Dutta T., Srivastava S.. Small RNA-mediated regulation in bacteria: a growing palette of diverse mechanisms. Gene. 2018; 656:60–72. - PubMed
    1. Chareyre S., Mandin P.. Bacterial iron homeostasis regulation by sRNAs. Microbiol. Spectr. 2018; 6:10.1128/microbiolspec.RWR-0010-2017. - DOI - PMC - PubMed

MeSH terms

LinkOut - more resources