. 2024 Jul 22;52(13):e59.
doi: 10.1093/nar/gkae496.

FRET-guided modeling of nucleic acids

Affiliations

FRET-guided modeling of nucleic acids

Fabio D Steffen et al. Nucleic Acids Res. .

Abstract

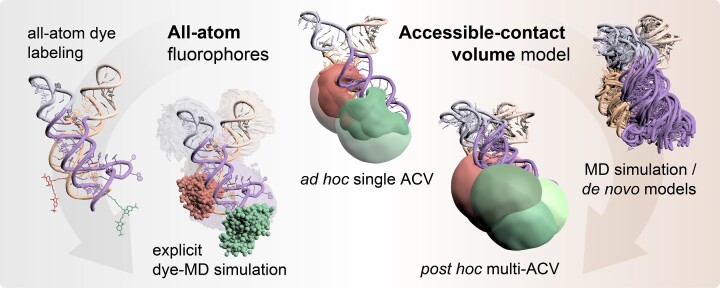
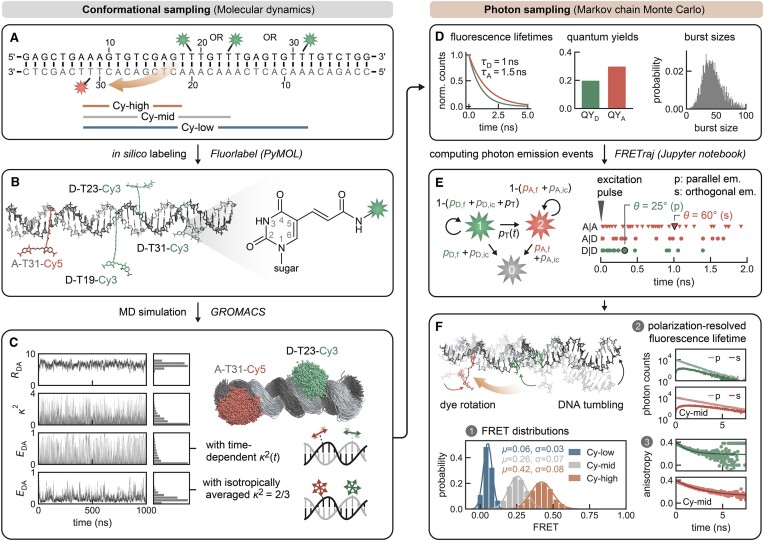
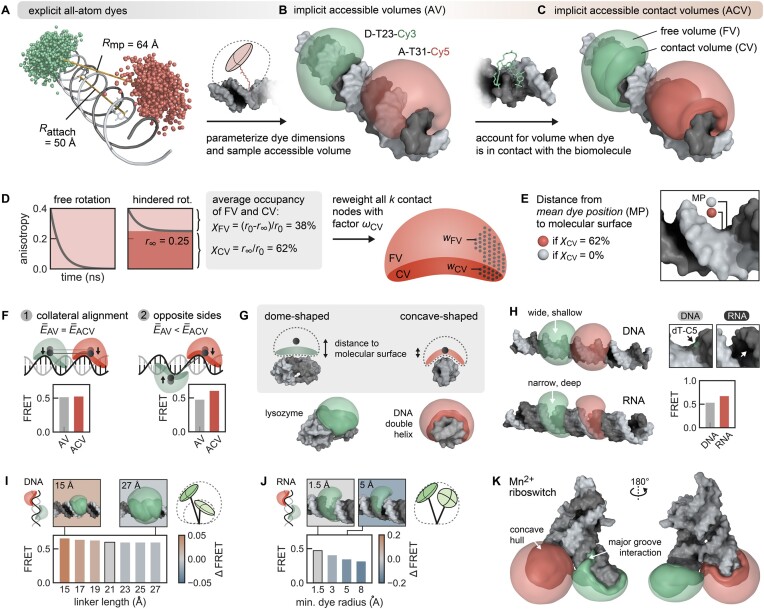
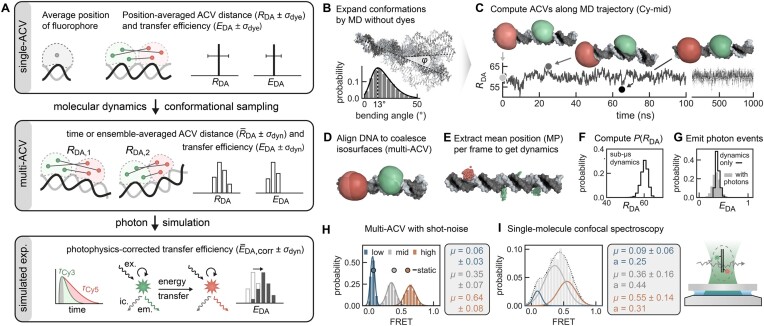
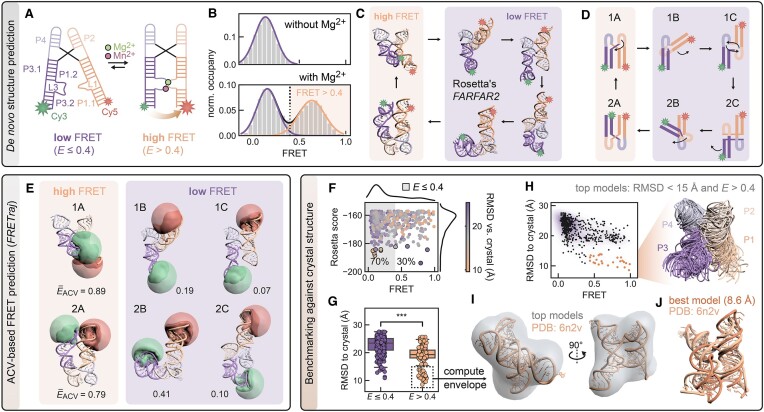
The functional diversity of RNAs is encoded in their innate conformational heterogeneity. The combination of single-molecule spectroscopy and computational modeling offers new attractive opportunities to map structural transitions within nucleic acid ensembles. Here, we describe a framework to harmonize single-molecule Förster resonance energy transfer (FRET) measurements with molecular dynamics simulations and de novo structure prediction. Using either all-atom or implicit fluorophore modeling, we recreate FRET experiments in silico, visualize the underlying structural dynamics and quantify the reaction coordinates. Using multiple accessible-contact volumes as a post hoc scoring method for fragment assembly in Rosetta, we demonstrate that FRET can be used to filter a de novo RNA structure prediction ensemble by refuting models that are not compatible with in vitro FRET measurement. We benchmark our FRET-assisted modeling approach on double-labeled DNA strands and validate it against an intrinsically dynamic manganese(II)-binding riboswitch. We show that a FRET coordinate describing the assembly of a four-way junction allows our pipeline to recapitulate the global fold of the riboswitch displayed by the crystal structure. We conclude that computational fluorescence spectroscopy facilitates the interpretability of dynamic structural ensembles and improves the mechanistic understanding of nucleic acid interactions.


Figures

Graphical Abstract
Graphical Abstract
Figure 1.
Figure 1.
Explicit all-atom fluorescence labeling enables in silico FRET prediction on a DNA molecular ruler (49). (A) The double-stranded DNA is labeled at residue T19, T23 or T31 with Cy3 and on the acceptor strand at T31 with Cy5. The FRET pairs are indicated as Cy-high (12 nt apart), Cy-mid (16 nt apart) and Cy-low (24 nt apart), respectively. (B) In silico labeling of the DNA helix via amino-modified deoxythymidines using the PyMOL plugin FRETlabel. (C) Structural ensemble from a 1 μs MD simulation showing point clouds of T23-Cy3 and T31-Cy5. Represented are the central carbon atoms of the polymethine chain of Cy3 and Cy5, respectively. The dye distance RDA, orientation factors κ2 and instantaneous FRET efficiency EDA (with either time-dependent κ2(t) and time-averaged κ2= 2/3) are monitored over the time course of the simulation. (D) Experimentally derived parameters (fluorescence lifetimes, quantum yields and burst sizes) define the relaxation rates in the Markov chain. (E) Donor and acceptor emission events after donor excitation (D|D and A|D) or by direct excitation of the acceptor (A|A) are simulated by Monte Carlo sampling and are assigned a polarization depending on the angle θ between the dye transition dipole at the time points of excitation and emission. (F) Shot-noise limited FRET distribution calculated by averaging over bursts from the 1 μs MD trajectory (all dynamics in the trajectory are fast compared to the burst duration; i.e. there are no slow conformational transitions). The polarization-resolved fluorescence lifetime and the derived dynamic anisotropy suggest some interactions of the dyes with the nucleic acid.
Figure 2.
Figure 2.
The ACV represents an anisotropic dye model incorporating free and surface-interacting fluorophores. (A) Comparison of the distance Rattach and Rmp from explicit dye simulations on a DNA helix. Rattach is the distance between the attachment sites (here C5 of dT). Rmp represents the distance between the centers of the dye point clouds sampled in the MD simulation. Because the dyes are coupled to the biomolecule via flexible linkers pointing outward, it holds that Rattach < Rmp. (B) The dye point cloud is modeled by AVs after parameterizing the dye probe as an ellipsoid (9,39,41). (C) The ACV incorporates a rim around the DNA denoted as the CV, which is occupied when the dye sticks to the molecular surface. (D) Grid nodes in the CV are reweighted to account for the 62% occupancy of the CV as determined by time-resolved anisotropy (Equations 1–3). (E) The CV fraction χCV influences the mean dye position (sphere) in the volume. (F) The ACV orientation affects the predicted FRET efficiency formula imageACV only when ACVs are oriented in trans, i.e. on opposite sides of a poly-GC DNA helix (case 2). The Förster radius is set to R0 = 38 Å (Cy3–Cy7), thus yielding transfer efficiencies around 0.5 and maximizing sensitivity. Bootstrapped standard deviations of the single ACVs in all bar charts are omitted for clarity. (G) The biomolecular topology modulates both the ACV shape and the mean position of the dye. The low curvature of globular proteins like lysozyme (PDB: 2lzm) results in a dome-shaped ACV. On the contrary, the ACV wraps around double-stranded DNA with the concave shape shifting the mean position closer to the molecular surface. (H) The surface accessibility of the attachment site (here dT/U-C5) shapes the ACV and FRET prediction as a result of the different major groove dimensions of the B-form DNA and A-form RNA. (I) The linker length has little effect on the FRET value (the selected linker is outlined). (J) The smallest dye radius determines whether the fluorophore can intercalate in the groove and in return affect FRET. (K) The Mn2+ riboswitch (PDB: 6n2v) features a complex architecture where ACVs in P2 and P4 highlight potential interaction sites for the dyes in the major groove.
Figure 3.
Figure 3.
Multi-ACVs simulate FRET-based conformational dynamics without the need of explicit dyes. (A) Schematic representation of distance metrics and their uncertainties in (multi)-ACV calculations. (B) Bending dynamics of the DNA FRET ruler are sampled by MD. (C) Serial ACVs are computed along the trajectory to define an RDA time trace with selected snapshots illustrating the bending motions of the DNA. (D) By aligning the DNA, the ACV isosurfaces coalesce (CVs were calculated but omitted for clarity in panels C and D). (E) Dye point clouds representing the mean position of the fluorophore are projected onto the idealized DNA helix. (E) Distribution of RDA distances sampled over the converged 1 μs MD trajectory. (F) Distances are converted to FRET efficiencies using Equation (5) (black line). (G) A Markov chain photon simulation (gray bars) accounts for additional broadening due to shot noise and dye quantum yields. (H, I) Comparison of the predicted FRET histograms from multi-ACV and single-molecule experiments. Single ACVs from ideal helices are indicated as spheres. The mean FRET efficiencies of the three subpopulations are recapitulated well by the simulations.
Figure 4.
Figure 4.
A proof-of-principle FRET-assisted de novo modeling pipeline selects candidate structures of a dynamic Mn2+ riboswitch compatible with single-molecule FRET experiments. (A) Secondary structure of low and high FRET folding states of the riboswitch mediated by Mg2+ and Mn2+ binding. (B) FRET histogram illustrating the docking dynamics of the distal helical legs of the riboswitch leading to a high FRET population >0.4. Data from (20). (C) To predict the structure of the folded FRET state de novo, 5000 candidate models are generated by Rosetta from the nucleotide sequence (Supplementary Figure S6). (D) Schematic architectural configurations of the stem loops P1–P4 categorized by orientation (classes A, B and C) and coaxial stacking (type 1 and type 2; see the text). (E) The top 500 models (selected by their Rosetta energy score) encompass candidates of all orientation classes and stacking types. A donor and acceptor ACV is computed for each of these candidates. (F) Next, models were filtered by applying a FRET cutoff at E> 0.4, which reduces the fraction of candidate structures compatible with the folded riboswitch by 70%. (G) The ensemble of remaining models has a significantly lower mean RMSD to the crystal structure, suggesting that a single FRET coordinate can sort out ill-configured models while retaining native ones. (H) Selection of models with an RMSD < 15 Å to the crystal structure. (I) Overlay of the top models represented as ribbons. (J) Crystal structure aligned into the density map that is computed from the top models. Structural alignment of the best FRET-assisted de novo model to the crystal structure (RMSD = 8.6 Å).

Similar articles

Cited by

References

    1. Rout M.P., Sali A. Principles for integrative structural biology studies. Cell. 2019; 177:1384–1403. - PMC - PubMed
    1. Bernetti M., Bussi G. Integrating experimental data with molecular simulations to investigate RNA structural dynamics. Curr. Opin. Struct. Biol. 2023; 78:102503. - PubMed
    1. Kappel K., Zhang K., Su Z., Watkins A.M., Kladwang W., Li S., Pintilie G., Topkar V.V., Rangan R., Zheludev I.N. et al. . Accelerated cryo-EM-guided determination of three-dimensional RNA-only structures. Nat. Methods. 2020; 17:699–707. - PMC - PubMed
    1. Malhotra S., Träger S., Dal Peraro M., Topf M. Modelling structures in cryo-EM maps. Curr. Opin. Struct. Biol. 2019; 58:105–114. - PubMed
    1. Dorn G., Leitner A., Boudet J., Campagne S., Von Schroetter C., Moursy A., Aebersold R., Allain F.H.-T. Structural modeling of protein–RNA complexes using crosslinking of segmentally isotope-labeled RNA and MS/MS. Nat. Methods. 2017; 14:487–490. - PMC - PubMed

LinkOut - more resources