. 2024 Nov;20(11):2529-2539.
doi: 10.1080/15548627.2024.2367183. Epub 2024 Jul 30.

CCDC50 mediates the clearance of protein aggregates to prevent cellular proteotoxicity

Affiliations

CCDC50 mediates the clearance of protein aggregates to prevent cellular proteotoxicity

Yu Ye et al. Autophagy. 2024 Nov.

Abstract

Protein aggregation caused by the disruption of proteostasis will lead to cellular cytotoxicity and even cell death, which is implicated in multiple neurodegenerative diseases. The elimination of aggregated proteins is mediated by selective macroautophagy receptors, which is termed aggrephagy. However, the identity and redundancy of aggrephagy receptors in recognizing substrates remain largely unexplored. Here, we find that CCDC50, a highly expressed autophagy receptor in brain, is recruited to proteotoxic stresses-induced polyubiquitinated protein aggregates and ectopically expressed aggregation-prone proteins. CCDC50 recognizes and further clears these cytotoxic aggregates through autophagy. The ectopic expression of CCDC50 increases the tolerance to stress-induced proteotoxicity and hence improved cell survival in neuron cells, whereas CCDC50 deficiency caused accumulation of lipid deposits and polyubiquitinated protein conjugates in the brain of one-year-old mice. Our study illustrates how aggrephagy receptor CCDC50 combats proteotoxic stress for the benefit of neuronal cell survival, thus suggesting a protective role in neurotoxic proteinopathy.Abbreviations: AD: Alzheimer disease; ALS: amyotrophic lateral sclerosis; ATG5: autophagy related 5; BODIPY: boron-dipyrromethene; CASP3: caspase 3; CCDC50: coiled-coil domain containing 50; CCT2: chaperonin containing TCP1 subunit 2; CHX: cycloheximide; CQ: chloroquine; CRISPR: clustered regulatory interspaced short palindromic repeat; Cas9: CRISPR-associated system 9; DAPI: 4',6-diamidino-2-phenylindole; FK2: Anti-ubiquitinylated proteins antibody, clone FK2; FUS: FUS RNA binding protein; GFP: green fluorescent protein; HD: Huntington disease; HTT: huntingtin; KEGG: Kyoto Encyclopedia of Genes and Genomes; LDS: LIR-docking site; LIR: LC3-interacting region; MAP1LC3/LC3: microtubule associated protein 1 light chain 3; MAPT/tau: microtubule associated protein tau; MIU: motif interacting with ubiquitin; NBR1: NBR1, autophagy cargo receptor; OPTN: optineurin; PD: Parkinson disease; PI: propidium iodide; ROS: reactive oxygen species; SOD1: superoxide dismutase 1; SQSTM1/p62: sequestosome 1; TAX1BP1: Tax1 binding protein 1; Ub: ubiquitin; UDS: UIM-docking site; UIM: ubiquitin interacting motif; UPS: ubiquitin-proteasome system.

Keywords: Aggrephagy receptor; CCDC50; neurodegenerative diseases; protein aggregation; proteostasis.


Conflict of interest statement

No potential conflict of interest was reported by the author(s).

Figures
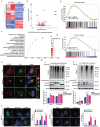
Figure 1.
Figure 1.
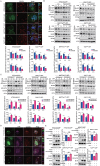
CCDC50 is recruited to protein aggregates in response to proteotoxic stresses and targets them for autophagic degradation. (A) Heatmap showing significantly differential expressed genes in shCCDC50 and shCtrl U87 cells. Rows indicate genes and columns represent samples. Colors represent relative expression levels, from blue to red meaning expression levels from low to high. (B) Volcano plot of differential expression analysis of shCCDC50 versus shCtrl, x-axis is log2 fold change and y-axis is adjusted p-value. The significantly differentially expressed genes were aligned to genes enriched in the KEGG pathways associated with AD, ALS, PD, HD and prion diseases; neurodegenerative disorder-related genes are then plotted. (C) Bubble plot of KEGG pathway analysis. X-axis indicates normalized enrichment score (NES), y-axis indicates pathways. The size of each dot represents the adjusted p-value. (D) the specific GSEA (gene set enrichment analysis) analysis of PD and HD pathways in shCCDC50 versus shCtrl U87 cells. The top part represents the enrichment score (ES), the bottom part shows the position of the member gene of the pathway. (E) Confocal microscopy analysis of the recruitment of endogenous CDC50 to FK2-positive foci in HeLa cells treated with 5 μg/ml puromycin for 2 h or 1 μM MG132 for 5 h; scale bar: 10 μm. (F) Immunoblot analysis of SQSTM1/p62-KO, CCDC50-KO and wild-type control HeLa cells treated with 5 μg/ml puromycin for 3 h. Quantification of normalized ubiquitin was performed by ImageJ software. (G) Immunoblot analysis of indicated protein components in SQSTM1/p62-KO, CCDC50-KO and wild-type control HeLa cells treated with 1 μM MG132 for 18 h. Quantification of normalized ubiquitin was performed by ImageJ software. (H) the images of FK2-positive foci in CCDC50-WT and CCDC50-KO HeLa cells treated with puromycin for 2 h or MG132 for 5 h. The quantification analysis was shown on the right panel; scale bar: 10 μm; n = 16, 39, 20, 36, 17, 25 cells for the corresponding column (from left to right) were counted. (I) Confocal microscopy analysis of FK2-positive foci in CCDC50-WT and CCDC50-KO HeLa cells treated with puromycin for 2 h followed by a 3-h washout. The quantification analysis was shown on the right panel; scale bar: 10 μm; n = 30 cells for each column were counted. Data are representative of at least two independent experiments and shown as mean with SEM (F-I). Two-tailed unpaired Student’s t-test (F-I); ACTA was used as a loading control. DE, differentially expressed. EE, equally expressed. NS, not significant. *p < 0.05, **p < 0.01, ***p < 0.001. See also Figure S1.
Figure 2.
Figure 2.
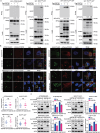
CCDC50 promotes the clearance of cytotoxic aggregation-prone proteins. (A) the colocalization analysis of endogenous CCDC50 and aggregation-prone proteins in HeLa cells transfected with EGFP-tagged HTT[Q103], SOD1G93A, MAPT/TauP301L and FUSP525L; scale bar: 10 μm. (B) Immunoblot analysis of HTT[Q103], SOD1G93A, MAPT/TauP301L and FUSP525L in Flag-empty vector or Flag-CCDC50 stably overexpressing HeLa cells treated with CHX (100 μg/ml) for indicated time points. The quantification analysis was shown on the lower panel. (C) Immunoblot analysis of HTT[Q103], SOD1G93A, MAPT/TauP301L and FUSP525L in CCDC50-WT and CCDC50-KO HeLa cells treated with CHX (100 μg/ml) for indicated time points. The quantification analysis was shown on the lower panel. (D) the colocalization analysis of aggregation-prone proteins, CCDC50 and LC3B in HeLa cells; scale bar: 10 μm. (E) Western blot analysis of HeLa cells co-transfected with HTT[Q103], SOD1G93A, MAPT/TauP301L and FUSP525L as well as HA-CCDC50 left untreated or treated with CQ for 6 h. The quantification analysis was performed by ImageJ software and shown on the right panel. Data are representative of three independent experiments (A, D); Quantification of normalized protein are indicated in B and C (two-way ANOVA, two independent experiments). Two-tailed unpaired Student’s t-test (E); *p < 0.05, **p < 0.01, ***p < 0.001; ACTA was used as a loading control. ST, stacking. See also Figure S2.
Figure 3.
Figure 3.
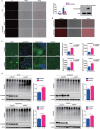
CCDC50 promotes SQSTM1/p62 clustering but can function independently of SQSTM1/p62. (A) Co-immunoprecipitation (with anti-Flag) and immunoblot analysis of the interaction between SQSTM1/p62 and aggregation-prone proteins with or without CCDC50 expression. The quantification analysis was performed by ImageJ software. (B) the colocalization analysis of CCDC50 and aggregation-prone proteins in wild-type or SQSTM1/p62-KO HeLa cells; scale bar: 10 μm. Quantification analysis of CCDC50 around aggregation-prone proteins were shown on the lower panel. (C) Immunoblot analysis of aggregation-prone proteins and CCDC50 in co-transfected SQSTM1/p62-WT and SQSTM1/p62-KO HeLa cells. The quantification analysis was performed by ImageJ software and shown on the right panel. Data are representative of three independent experiments and shown as mean with SEM (B, C); ACTA was used as a loading control. Two-tailed unpaired Student’s t-test (B); two-way ANOVA (C). *p < 0.05, **p < 0.01, ***p < 0.001. See also Figure S3.
Figure 4.
Figure 4.
CCDC50 deficiency leads to accumulation of lipid deposits and high-molecular-weight Ub-conjugates in mouse brains. (A) the PI and Hoechst staining of wild-type and CCDC50-overexpressing Neuro 2a cells imposed by MG132 (2.5 μM) proteotoxic stress for 36 h; scale bar: 100 μm. The expression of CCDC50 and the quantification analysis of PI-positive cells were shown on the right panel; n = 7632, 9339, 5193, 3508 cells in three independent experiments were quantified. (B) the Nile red staining of CCDC50-WT and CCDC50-KO HeLa cells; scale bar: 100 μm. (C) Representative images of lipid deposits (green puncta) of cortex, striatum, hippocampus, and cerebellum isolated from 1-year-old male Ccdc50+/+ and ccdc50−/− mice. Nuclei stained with DAPI. Scale bars: 50 μm. The sample sizes were also plotted. (D) Immunoblot analysis of Ub-conjugates in lysates from striatum, cerebellum, cortex, and hippocampus of 1-year-old male Ccdc50+/+ and ccdc50−/− mice. The quantification analysis was performed by ImageJ software and shown on the right panel. The sample sizes were also plotted. Data are representative of three independent experiments and shown as mean with SEM (A, D); ACTA was used as a loading control. Two-way ANOVA test (A). Two-tailed unpaired Student’s t-test (D). *p < 0.05, **p < 0.01, ***p < 0.001. See also Figure S4.

Similar articles

Cited by

References

    1. Hipp MS, Kasturi P, Hartl FU.. The proteostasis network and its decline in ageing. Nat Rev Mol Cell Biol. 2019. Jul;20(7):421–435. doi: 10.1038/s41580-019-0101-y - DOI - PubMed
    1. Davis AA, Leyns CEG, Holtzman DM. Intercellular spread of protein aggregates in neurodegenerative disease. Annu Rev Cell Dev Biol. (2018 Oct 6);34(1):545–568. doi: 10.1146/annurev-cellbio-100617-062636 - DOI - PMC - PubMed
    1. Kurtishi A, Rosen B, Patil KS, et al. Cellular proteostasis in neurodegeneration. Mol Neurobiol. 2019. May;56(5):3676–3689. doi: 10.1007/s12035-018-1334-z - DOI - PubMed
    1. Balchin D, Hayer-Hartl M, Hartl FU. In vivo aspects of protein folding and quality control. Science. (2016 Jul 1);353(6294):aac4354. doi: 10.1126/science.aac4354 - DOI - PubMed
    1. Pla-Prats C, Thoma NH. Quality control of protein complex assembly by the ubiquitin-proteasome system. Trends Cell Biol. 2022. Aug;32(8):696–706. doi: 10.1016/j.tcb.2022.02.005 - DOI - PubMed

Publication types

Substances