. 2024 Aug 5;221(8):e20232066.
doi: 10.1084/jem.20232066. Epub 2024 Jun 13.

Gain-of-function human UNC93B1 variants cause systemic lupus erythematosus and chilblain lupus

Affiliations

Gain-of-function human UNC93B1 variants cause systemic lupus erythematosus and chilblain lupus

Clémence David et al. J Exp Med. .

Abstract

UNC93B1 is a transmembrane domain protein mediating the signaling of endosomal Toll-like receptors (TLRs). We report five families harboring rare missense substitutions (I317M, G325C, L330R, R466S, and R525P) in UNC93B1 causing systemic lupus erythematosus (SLE) or chilblain lupus (CBL) as either autosomal dominant or autosomal recessive traits. As for a D34A mutation causing murine lupus, we recorded a gain of TLR7 and, to a lesser extent, TLR8 activity with the I317M (in vitro) and G325C (in vitro and ex vivo) variants in the context of SLE. Contrastingly, in three families segregating CBL, the L330R, R466S, and R525P variants were isomorphic with respect to TLR7 activity in vitro and, for R525P, ex vivo. Rather, these variants demonstrated a gain of TLR8 activity. We observed enhanced interaction of the G325C, L330R, and R466S variants with TLR8, but not the R525P substitution, indicating different disease mechanisms. Overall, these observations suggest that UNC93B1 mutations cause monogenic SLE or CBL due to differentially enhanced TLR7 and TLR8 signaling.


Conflict of interest statement

Disclosures: C. Paul reported personal fees from Abbvie, Boehringer, BMS, Eli Lilly, and Janssen; grants from Novartis; and personal fees from Pfizer, Sanofi, Pierre Fabre, and UCB outside the submitted work. D. Bonnet reported personal fees from Novartis and MSD outside the submitted work. No other disclosures were reported.

Figures

Figure 1.
Figure 1.
UNC93B1 genetic data. (A) Family pedigrees where an affected individual carries a heterozygous or homozygous rare non-synonymous missense substitution in UNC93B1. Circles and squares indicate female and male family members, respectively. (B) Clustal Omega alignment of UNC93B1 with identified non-synonymous missense substitutions is highlighted in yellow. Alignments are based on the human transcript of UNC93B1: ENST00000227471.7/NM_030930.4; NP_112192.2.
Figure 2.
Figure 2.
UNC93B1 variants have different consequences on TLR signaling. (A) Protein expression level of WT and UNC93B1 variants transfected in HEK293T cells, assessed by western blot using anti-V5 tag for transfected UNC93B1. Vinculin is a loading control. Representative experiment of n = 2. (B) UNC93B1 protein levels in primary fibroblasts of R525P P1 and three control primary fibroblasts assessed by western blot using indicated antibodies. Vinculin and cofilin are loading controls. Representative experiment. (C–F) NF-κB reporter luciferase activity following transfection of HEK293T cells with (C) TLR7, (D) TLR8, (E) TLR3, (F) TLR9 plasmids and EV, WT, and variant UNC93B1 stimulated respectively with (C) R848 0.01 µg/ml, (D) R848 0.1 µg/ml, (E) poly(I:C) 2.5 µg/ml, and (F) CpG-B 1 µM. Data are expressed as the fold-induction of the RLU of the stimulated sample over the RLU of the respective non-stimulated (NS) sample for each UNC93B1 condition (“fold stimulated”), normalized to the fold stimulated obtained for WT UNC93B1. Mean ± SEM of n = 3–4 experiments. One-way ANOVA with Dunnett’s post-hoc test: ****P < 0.0001, ***P < 0.001, **P < 0.01, *P < 0.05. Source data are available for this figure: SourceData F2.
Figure S1.
Figure S1.
Effect of patient variants on mRNA expression and of gnomAD variants on TLR signaling. (A) UNC93B1 mRNA level in primary fibroblasts of R525P P1 and three control primary fibroblast lines, assessed by qPCR and normalized to HPRT mRNA, and expressed as fold over one control fibroblast line dataset. Representative experiment. (B) NF-κB reporter luciferase activity following transfection of HEK293T cells with TLR7, TLR8, TLR3, or TLR9 plasmids and EV or WT UNC93B1 stimulated with indicated concentrations of R848, poly(I:C) or CpG-B. Data are expressed as the fold-induction of the RLU of the stimulated sample over the RLU of the respective NS sample for each UNC93B1 condition (“fold of respective NS”). Arrows indicate the dose of ligand chosen to study UNC93B1 variant gain of signaling in Fig. S1, C–F; and Fig. 2, C–F. Mean ± SEM of n = 2–4 experiments. (C–F) NF-κB reporter luciferase activity following transfection of HEK293T cells with (C) TLR7, (D) TLR8, (E) TLR3, (F) TLR9 plasmids and EV, WT, and gnomAD variant UNC93B1 stimulated respectively with (C) R848 0.01 µg/ml, (D) R848 0.1 µg/ml, (E) poly(I:C) 2.5 µg/ml, and (F) CpG-B 1 µM. Data are expressed as the fold-induction of the RLU of the stimulated sample over the RLU of the respective NS sample for each UNC93B1 condition (“fold stimulated”), normalized to the fold stimulated obtained for WT UNC93B1. Mean ± SEM of n = 3 experiments. One-way ANOVA with Dunnett’s post-hoc test. (G and H) NF-κB reporter luciferase activity following transfection of HEK293T cells with (G) TLR7 and (H) TLR8 plasmids and WT UNC93B1 together with the same amount of EV, WT and indicated variant UNC93B1 stimulated respectively with (G) R848 0.01 µg/ml, and (H) R848 0.1 µg/ml. Data are expressed as the fold-induction of the RLU of the stimulated sample over the RLU of NS sample for each UNC93B1 condition (“fold stimulated”), normalized to the fold stimulated obtained for WT UNC93B1. Mean ± SEM of n = 3 experiments. One-way ANOVA with Dunnett’s post-hoc test. (I) NF-κB reporter luciferase activity following transfection of HEK293T cells with TLR7, TLR8, TLR3, or TLR9 plasmids and EV, WT, or variant UNC93B1 without stimulation. Data are expressed as the RLU normalized to WT UNC93B1 RLU. Mean ± SEM of n = 2–4 experiments. One-way ANOVA with Dunnett’s post-hoc test. ****P < 0.0001, ***P < 0.001, **P < 0.01, *P < 0.05.
Figure 3.
Figure 3.
TLR signaling ex vivo. (A) ISG expression was measured in controls and patients, using either a 27 (left) or 6 (right) ISG panel (measured on a NanoString platform or using RT-qPCR, respectively) to calculate an IFN score. Colors denote individuals. Values correlate to data presented in Table S1. (B–E) Ex vivo stimulation of blood cells. (B and D) IFNα and TNF production following stimulation of TLR7 (CL264 5 µg/ml), TLR8 (TL8-506 10 ng/ml), and TLR7/8 (R848 0.5 µg/ml), in bulk PBMCs. (C and E) IFNα and TNF production following stimulation of TLR7 (CL264 5 µg/ml), TLR8 (TL8-506 10 ng/ml), and TLR7/8 (R848 0.5 µg/ml) in sorted monocytes. Cells were extracted from healthy individuals (controls), one symptomatic patient (G325C-P2) and one asymptomatic individual (G325C-P1) heterozygous for the G325C substitution (B and C), and two clinically symptomatic patients (R525P-P1 and R525P-P2) heterozygous for the R525P substitution (D and E) in UNC93B1. Mean ± SEM of two to three experiments with individual patient data represented by symbols and pooled according to mutation. Two-way ANOVA with Sidak’s post-hoc test (NS, CL264, and TL8-506) or Mann–Whitney test (R848): ****P < 0.0001, **P < 0.01, *P < 0.05. Source data are available for this figure: SourceData F3.
Figure S2.
Figure S2.
Immunophenotyping of UNC93B1 patients and structural characterization of variants. (A–E) Deep immunophenotyping by mass cytometry of immune cell subsets in healthy adults, healthy children 5–15 years old, symptomatic patients carrying the R525P mutation (R525P-P1, R525P-P2), and the asymptomatic mother (G325C-P1) and her symptomatic daughter (G325C-P2) carrying the G325C mutation. (A) Immunophenotyping of T cell subsets. (B) Immunophenotyping of innate T and lymphoid cell subsets. (C) Immunophenotyping of B cell subsets. (D) Immunophenotyping of pDCs. (E) Immunophenotyping of monocytes and conventional DC subsets. (F and H) IFNα and TNF production following stimulation of TLR9 (CpG-A 0.5 µM and CpG-B 0.1 µM) in bulk PBMCs. (G and I) IFNα and TNF production following stimulation of TLR7 (R848 0.5 µg/ml, pDCs are not responding to TLR8 ligands) and TLR9 (CpG-B 0.1 µM and CpG-A 0.25 µM [G] or CpG-A 1 µM [I]) in sorted pDCs. NT: not tested. Cells were extracted from healthy individuals (controls), one symptomatic patient (G325C-P2), and one asymptomatic individual (G325C-P1) heterozygous for the G325C substitution (F and G), and two clinically symptomatic patients (R525P-P1 and R525P-P2) heterozygous for the R525P substitution (H and I) in UNC93B1. (F, H, and I) Mean ± SEM of two to three experiments with individual patient data represented by symbols and pooled in H and I. (G) Single experiment with two controls. Two-way ANOVA with Sidak’s post-hoc test: ****P < 0.0001, ***P < 0.001, **P < 0.01, *P < 0.05. (J) Location of pathogenic missense mutations within the structure of the UNC93B1-TLR7 complex (UNC93B1 in yellow; TLR7 in green, AlphaFold-Multimer predicted model). The locations of the five mutations identified in this report are shown in red, together with previously reported D34A mutation (mouse; Fukui et al., 2011) in gray. E92G and R336L (human; Wolf et al., 2024) mutations, and recently published variants at E49 (E49dup; Mishra et al., 2024), V117, and T314 (V117L, T314A; Al-Azab et al., 2023, Preprint) are shown in blue. On the right, a view from the cytoplasmic side is represented. (K) Predicted structural impact of UNC93B1 variants computed from AlphaFold-Multimer models on UNC93B1 complexes with different TLRs (as shown). Each box contains five data points corresponding to the five AlphaFold models. Box, 25th and 75th percentiles; middle line, median; whiskers, 1.5 times the interquartile range.
Figure 4.
Figure 4.
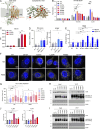
Interaction of UNC93B1 variants with TLR7/8 and functional consequences. (A) Location of pathogenic missense mutations within the structure of the TLR7:UNC93B1 complex (AlphaFold-Multimer predicted structure). Note that the TLR7 and TLR8 structures are very similar (TM score of 0.89). The location of the five mutations identified in this report is shown in red, together with the previously described D34A (mouse; Fukui et al., 2011) and E92G (human; Wolf et al., 2024) mutations. On the right, a view from the cytoplasmic side is represented. (B) NF-κB SEAP reporter assay in THP-1 Dual cells transduced with EV, WT, and variant UNC93B1 (pTrip-SFFV-GFP-2A construct) unstimulated (NS) or stimulated for 16 h with TL8-506 (0.1 µg/ml) or CL307 (5 µg/ml). Data are expressed as fold induction over WT NS. Mean ± SEM of n = 4–5 experiments. Two-way ANOVA with Dunnett’s post-hoc test. (C) ISG15 expression, assessed by intracellular staining and flow cytometry, in THP-1 cells stably expressing WT, L330R, or R525P UNC93B1 (pTrip-CMV-Puro-2A construct) and stimulated for 16 h with TL8-506 (1 µg/ml) or NS. Mean ± SEM of n = 3 experiments. Two-way ANOVA with Dunnett’s post-hoc test. MFI: mean fluorescence intensity. (D) ISG score (median of the relative mRNA levels of the ISGs IFI27, IFI44L, OAS1, and IFIT1) and IFNB1 expression in THP-1 cells stably transduced with EVs (EV1, EV2) or vectors carrying two different sgRNA targeting syntenin-1/SDCBP gene (sgSyn-1a and sgSyn-1b) and stimulated for 24 h with TL8-506 (1 µg/ml). mRNA was assessed by qPCR, normalized to HPRT mRNA, and expressed as fold induction over EV1 in the NS condition. Mean ± SEM of n = 5–6 experiments. Kruskal–Wallis test with Dunnett’s post-hoc analysis. (E) NF-κB SEAP reporter assay in control (shNTgt) or syntenin-1 KO (sgSyn-1b) THP-1 Dual cells stably transduced with EV, WT, and variant UNC93B1 (pTrip-SFFV-GFP-2A construct) stimulated for 16 h with R848 (5 µg/ml). Data are expressed as fold induction over WT NS. Mean ± SEM of n = 4 experiments. Two-way ANOVA with Dunnett’s post-hoc test. (F) PLA showing UNC93B1-TLR8 association (yellow dots) in THP-1 cells stably transduced as in B detected using the Duolink proximity ligation assay with anti-V5 (for UNC93B1) and anti-TLR8 specific antibodies. Cells were treated with R848 (0.5 µg/ml) for 30 min or left untreated (not stimulated, NS). Nuclei (blue) were stained with DAPI. (G) PLA signals were quantified with Icy (n = 3 experiments, n = 104 cells for UNC93B1-WT NS, n = 92 cells for UNC93B1-WT + R848, n = 113 cells for UNC93B1-I317M NS, n = 110 for UNC93B1-I317M + R848, n = 97 cells for UNC93B1-G325C NS, n = 86 for UNC93B1-G325C + R848, n = 118 cells for UNC93B1-L330R NS, n = 122 for UNC93B1-L330R + R848, n = 99 cells for UNC93B1-R466S NS, n = 91 for UNC93B1-R466S + R848, n = 107 cells for UNC93B1-R525P NS, n = 95 for UNC93B1-R525P + R848) and represented using box (quartiles) and whisker plots with 10–90% error bars. One-way ANOVA with Tukey’s post-hoc analysis for comparisons to WT NS. #: P < 0.05 in WT + R848 versus R466S + R848 comparison. (H and I) Co-immunoprecipitation of V5-tagged UNC93B1 in the lysate of 293FT cells cotransfected with TLR8 (H) or TLR7 (I) and UNC93B1-V5 WT and variants using anti-V5 beads (V5 immunoprecipitation), followed by western blot analysis using indicated antibodies (representative blot). (J) Quantification of TLR8 or TLR7 band intensity over UNC93B1-V5 band intensity in the IP fraction (related to H and I, respectively). Mean ± SEM of n = 2–3 independent experiments. One-way ANOVA with Holm–Sidak’s post-hoc analysis. ****P < 0.0001, ***P < 0.001, **P < 0.01, *P < 0.05. Source data are available for this figure: SourceData F4.
Figure S3.
Figure S3.
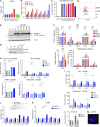
Characterization of TLR8 signaling in THP-1 cells. (A) ISG15 expression, assessed by intracellular staining and flow cytometry, in THP-1 cells stimulated for 16 h with CL264 (10 µg/ml), CL307 (TLR7 agonist) (1 µg/ml), R848 (10 µg/ml), TL8-506 (1 µg/ml), CpG-A (5 µM), and CpG-B (5 µM). Relative MFI: mean fluorescence intensity of stimulated condition over NS condition. Mean ± SEM of n = 3 experiments. (B) Relative mRNA levels of indicated genes in THP-1 cells stimulated for 16 h with CL307 (1 µg/ml) or TL8-506 (1 µg/ml). mRNA was assessed by qPCR, normalized to HPRT mRNA, and expressed as a fold induction over NS condition. Mean ± SEM of n = 4 experiments. (C) V5-tagged UNC93B1 expression, assessed by intracellular staining of V5 and flow cytometry, in THP-1 cells stably expressing EV, WT, and variant UNC93B1 (pTrip-SFFV-GFP-2A construct), or non-transduced (NT). Mean ± SEM of n = 3 experiments. (D) V5-tagged UNC93B1 expression, assessed by intracellular staining of V5 (PE) and flow cytometry, in THP-1 cells stably expressing WT, L330R, or R525P UNC93B1, or an EV (pTrip-CMV-Puro-2A construct). Overlayed histogram of PE intensity is shown. Representative experiment of n = 2. (E) Western blot of non-transduced (NT), EV- and UNC93B1-V5-transduced THP-1 protein lysates (pTrip-SFFV-GFP-2A construct), using a conformational anti-UNC93B1 antibodies. Endogenous UNC93B1 migrates at 65 kDa, while the overexpressed, V5-tagged UNC93B1 migrates at a higher molecular weight. (F) Relative mRNA levels of indicated genes in THP-1 cells transduced with EV, WT, and variant UNC93B1 (pTrip-SFFV-GFP-2A construct) and stimulated for 16 h with R848 (1 µg/ml), assessed by qPCR, normalized to HPRT mRNA, and expressed as fold induction over WT NS condition. Mean ± SEM of n = 3 experiments. Two-way ANOVA with Dunnett’s post-hoc test, except for IFNB1: one-way ANOVA with Holm–Sidak post-hoc test. (G) Syntenin-1 expression level in THP-1 cells stably transduced with EVs (EV1, EV2) or vectors carrying two single sgRNA targeting syntenin-1/SDCBP gene (sgSyn-1a and sgSyn-1b), harvested 7 days after transduction and selection, and assessed by western blot. Vinculin is a loading control. Representative experiment of n = 3. (H) Baseline ISG score (median of the relative mRNA levels of the ISGs IFI27, IFI44L, OAS1, and IFIT1), ISGs, IFNB1, and inflammatory cytokine (IL6, IL8, and TNF) expression in THP-1 cells stably transduced with EVs (EV1, EV2) or vectors carrying two single sgRNA targeting syntenin-1/SDCBP gene (sgSyn-1a and sgSyn-1b), at baseline, harvested 7–10 days after transduction and selection. mRNA was assessed by qPCR, normalized to HPRT mRNA, and expressed as a fold induction over EV1. Mean ± SEM of n = 6–10 experiments. (I) ISGs and inflammatory cytokine (IL6, IL8, and TNF) expression in THP-1 cells stably transduced with EVs (EV1, EV2) or vectors carrying sgRNA targeting syntenin-1/SDCBP gene, stimulated for 24 h with TL8-506 (1 µg/ml). mRNA was assessed by qPCR, normalized to HPRT mRNA, and expressed as a percentage of the averaged EV1-EV2 fold stimulation over the NS condition. Mean ± SEM of n = 6–10 experiments. (H and I) Kruskal–Wallis test with Dunnett’s post-hoc analysis (for ISG score and IFNB1); mixed-effects analysis (REML; restricted maximum likelihood) with uncorrected Fisher’s test (for ISGs and inflammatory cytokines). (J and K) NF-κB SEAP reporter assay in control (sgNTgt) or syntenin-1 KO (sgSyn-1b) THP-1 Dual cell pools stably transduced with EV, WT, and variant UNC93B1 (pTrip-SFFV-GFP-2A construct) stimulated for 16 h with (J) TL8-506 (0.1 µg/ml) and (K) CL307 (5 µg/ml). Data are expressed as fold induction over WT NS. Mean ± SEM of n = 7–8 experiments. (L) ISG score (median of the relative mRNA levels of the ISGs IFI27, IFI44L, OAS1, and IFIT1) in control (sgNTgt) or TLR8 KO (sgTLR8) THP-1 cell pools stimulated for 24 h with TL8-506 (1 µg/ml). mRNA was assessed by qPCR, normalized to HPRT mRNA, and expressed as a fold induction over control (sgNtgt) in the NS condition. Mean ± SEM of n = 2 experiments. (M) PLA assessing UNC93B1-TLR8 association (yellow dots) with anti-V5 (for UNC93B1) and anti-TLR8 specific antibodies, as in Fig. 4 F, in unstimulated TLR8 KO THP-1 cell pools stably transduced with WT UNC93B1-V5. No PLA signal is detected. Nuclei (blue) were stained with DAPI, scale bar: 5 μm. Two-way ANOVA with Dunnett’s post-hoc test. ****P < 0.0001, ***P < 0.001, **P < 0.01, *P < 0.05.

References

    1. Al-Azab, M., Idiiatullina E., Lin M., Hrovat-Schaale K., Xian H., Zhu J., Yang M., Lu B., Liu Z., Zhao Z., et al. . 2023. Genetic variants in UNC93B1 predispose to childhood-onset systemic lupus erythematosus. medRxiv. 10.1101/2023.10.15.23296507 (Preprint posted October 16, 2023). - DOI - PMC - PubMed
    1. Al-Mayouf, S.M., Sunker A., Abdwani R., Abrawi S.A., Almurshedi F., Alhashmi N., Al Sonbul A., Sewairi W., Qari A., Abdallah E., et al. . 2011. Loss-of-function variant in DNASE1L3 causes a familial form of systemic lupus erythematosus. Nat. Genet. 43:1186–1188. 10.1038/ng.975 - DOI - PubMed
    1. Aluri, J., Bach A., Kaviany S., Chiquetto Paracatu L., Kitcharoensakkul M., Walkiewicz M.A., Putnam C.D., Shinawi M., Saucier N., Rizzi E.M., et al. . 2021. Immunodeficiency and bone marrow failure with mosaic and germline TLR8 gain of function. Blood. 137:2450–2462. 10.1182/blood.2020009620 - DOI - PMC - PubMed
    1. Asano, T., Boisson B., Onodi F., Matuozzo D., Moncada-Velez M., Maglorius Renkilaraj M.R.L., Zhang P., Meertens L., Bolze A., Materna M., et al. . 2021. X-linked recessive TLR7 deficiency in ∼1% of men under 60 years old with life-threatening COVID-19. Sci. Immunol. 6:eabl4348. 10.1126/sciimmunol.abl4348 - DOI - PMC - PubMed
    1. Barber, M.R.W., Drenkard C., Falasinnu T., Hoi A., Mak A., Kow N.Y., Svenungsson E., Peterson J., Clarke A.E., and Ramsey-Goldman R.. 2021. Global epidemiology of systemic lupus erythematosus. Nat. Rev. Rheumatol. 17:515–532. 10.1038/s41584-021-00668-1 - DOI - PMC - PubMed

MeSH terms

Supplementary concepts