

Revolutionary multi-omics analysis revealing prognostic signature of thyroid cancer and subsequent in vitro validation of SNAI1 in mediating thyroid cancer progression through EMT
- PMID: 38869635
- PMCID: PMC11176101
- DOI: 10.1007/s10238-024-01387-z
Revolutionary multi-omics analysis revealing prognostic signature of thyroid cancer and subsequent in vitro validation of SNAI1 in mediating thyroid cancer progression through EMT
Abstract
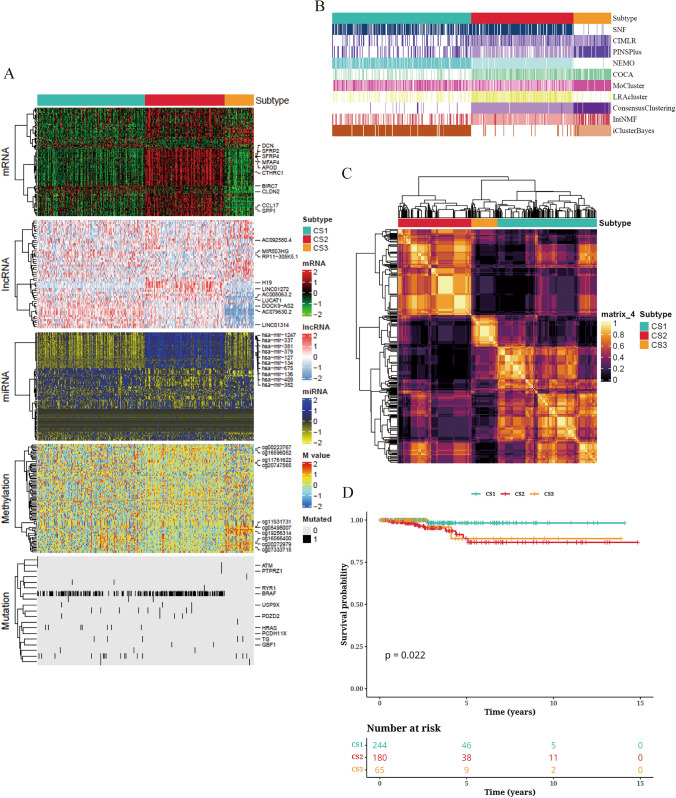
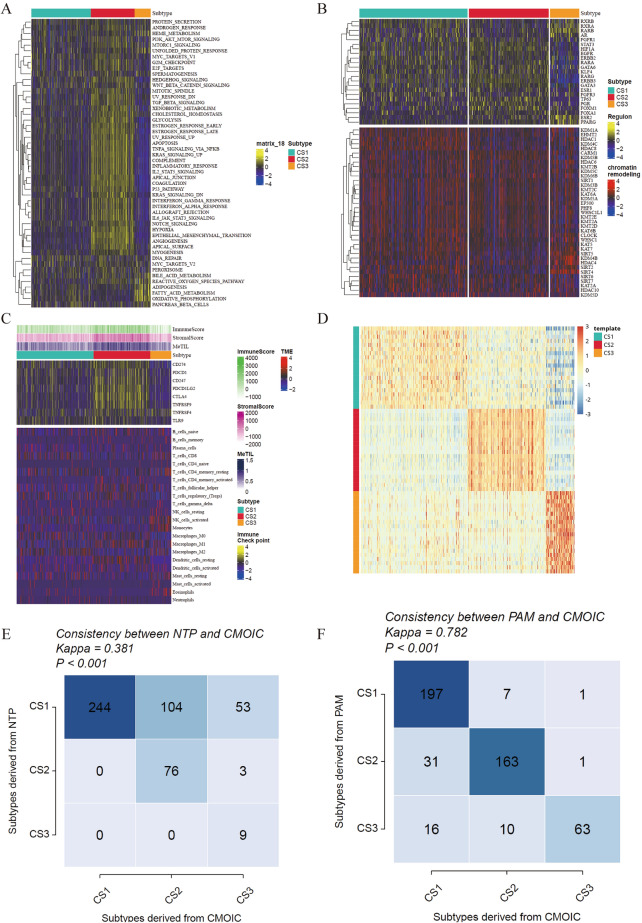
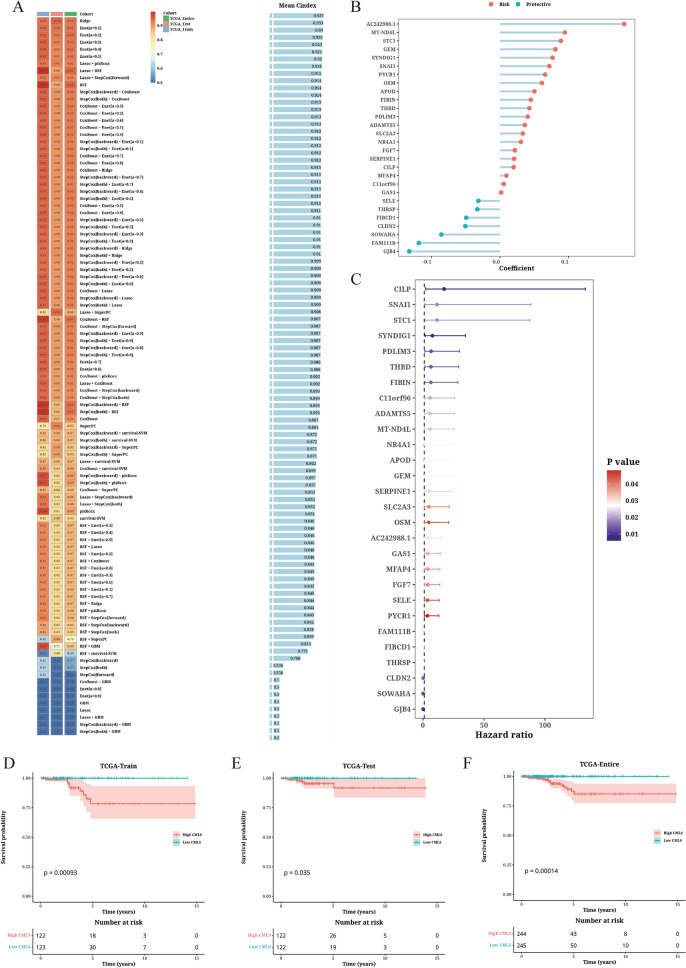
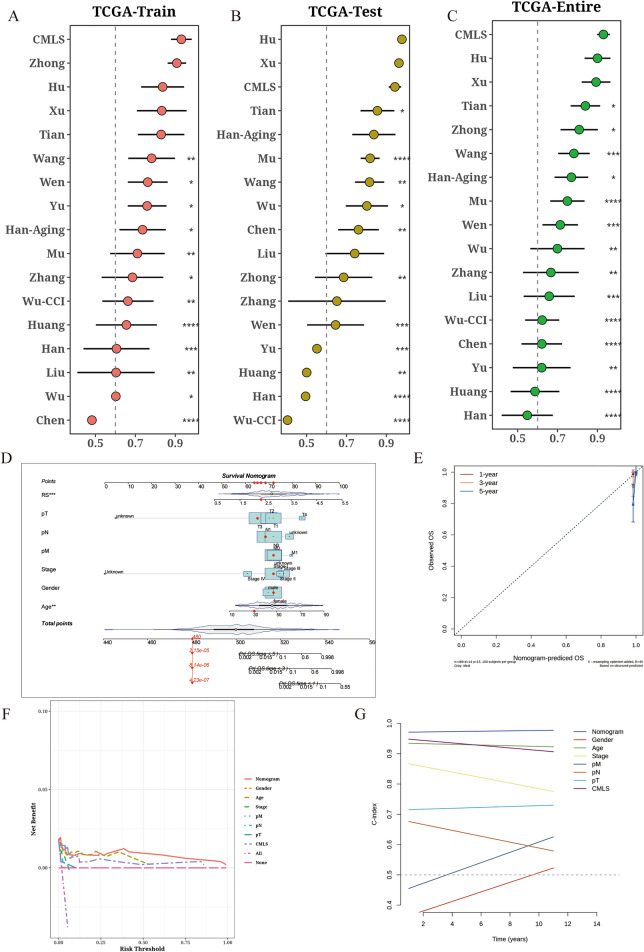
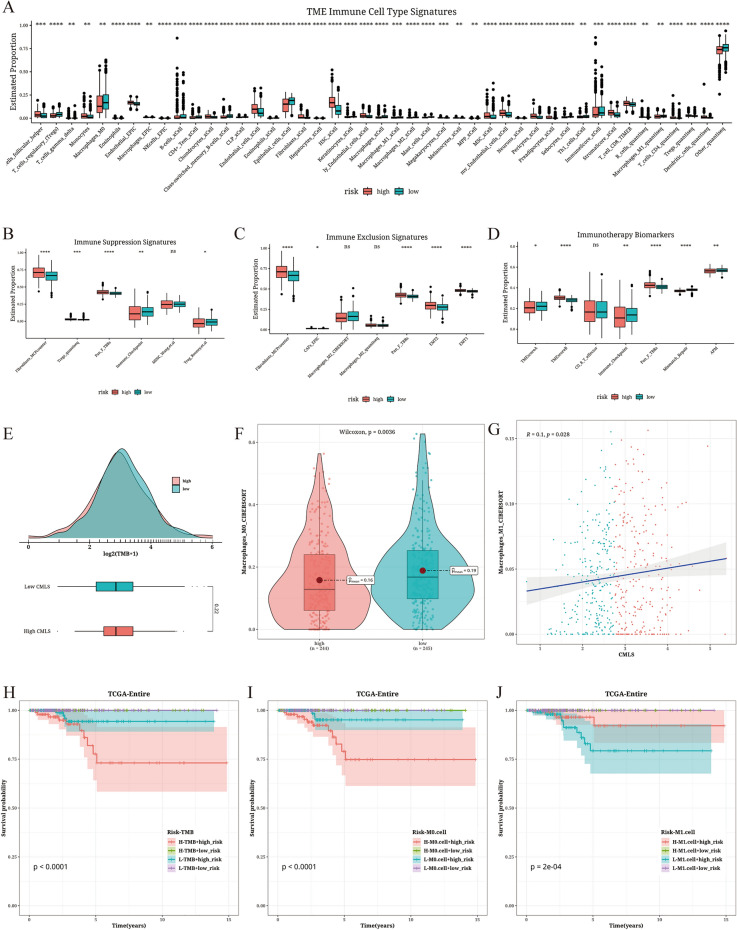
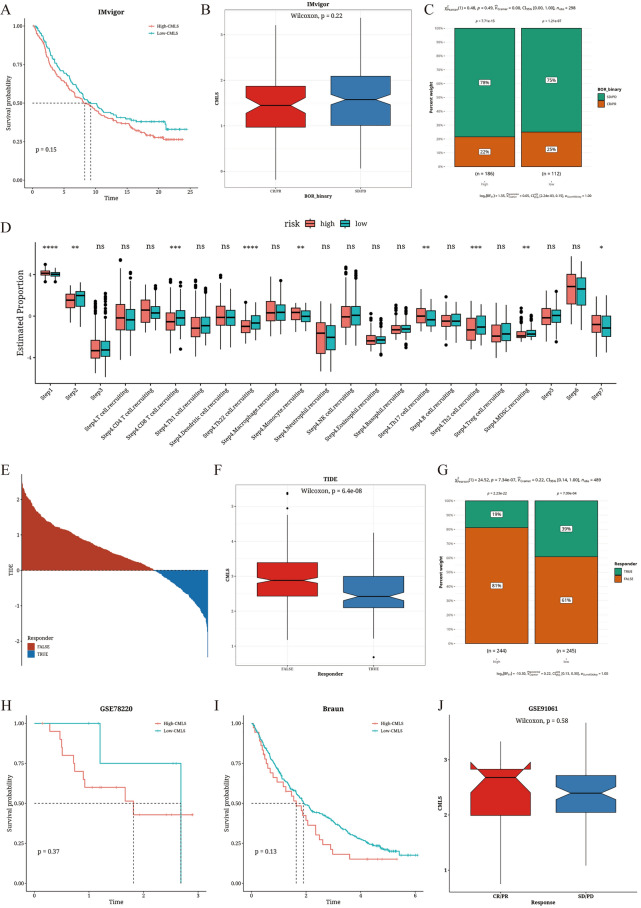
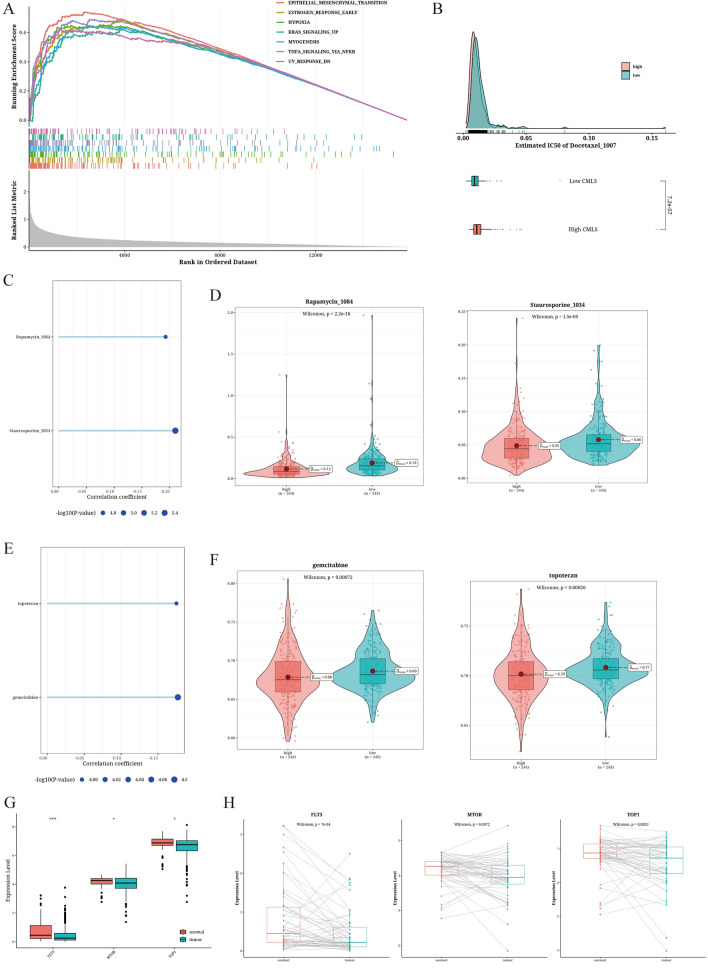
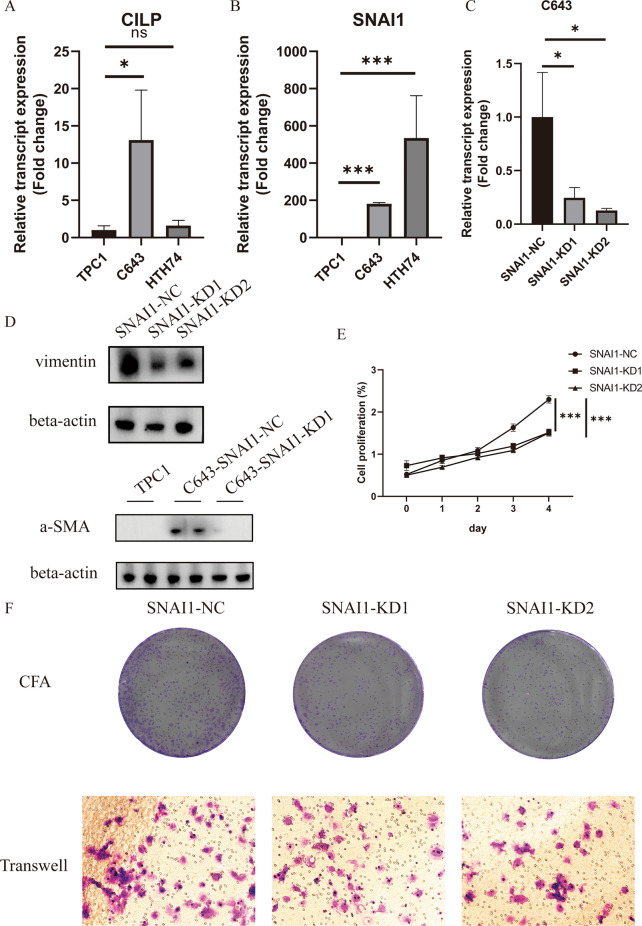
Thyroid carcinoma (TC), the most commonly diagnosed malignancy of the endocrine system, has witnessed a significant rise in incidence over the past few decades. The integration of scRNA-seq with other sequencing approaches offers researchers a distinct perspective to explore mechanisms underlying TC progression. Therefore, it is crucial to develop a prognostic model for TC patients by utilizing a multi-omics approach. We acquired and processed transcriptomic data from the TCGA-THCA dataset, including mRNA expression profiles, lncRNA expression profiles, miRNA expression profiles, methylation chip data, gene mutation data, and clinical data. We constructed a tumor-related risk model using machine learning methods and developed a consensus machine learning-driven signature (CMLS) for accurate and stable prediction of TC patient outcomes. 2 strains of undifferentiated TC cell lines and 1 strain of PTC cell line were utilized for in vitro validation. mRNA, protein levels of hub genes, epithelial-mesenchymal transition (EMT)-associated phenotypes were detected by a series of in vitro experiments. We identified 3 molecular subtypes of TC based on integrated multi-omics clustering algorithms, which were associated with overall survival and displayed distinct molecular features. We developed a CMLS based on 28 hub genes to predict patient outcomes, and demonstrated that CMLS outperformed other prognostic models. TC patients of relatively lower CMLS score had significantly higher levels of T cells, B cells, and macrophages, indicating an immune-activated state. Fibroblasts were predominantly enriched in the high CMLS group, along with markers associated with immune suppression and evasion. We identified several drugs that could be suitable for patients with high CMLS, including Staurosporine_1034, Rapamycin_1084, gemcitabine, and topotecan. SNAI1 was elevated in both undifferentiated TC cell lines, comparing to PTC cells. Knockdown of SNAI1 reduced the cell proliferation and EMT phenotypes of undifferentiated TC cells. Our findings highlight the importance of multi-omics analysis in understanding the molecular subtypes and immune characteristics of TC, and provide a novel prognostic model and potential therapeutic targets for this disease. Moreover, we identified SNAI1 in mediating TC progression through EMT in vitro.
Keywords: EMT; Multi-omics analysis; Prognostic model; Proliferation; SNAI1; Thyroid cancer.
© 2024. The Author(s).
Conflict of interest statement
The authors declare that the research was conducted in the absence of any commercial or financial relationships that could be construed as a potential conflict of interest.
Figures
Similar articles
-
Combining multi-omics analysis with machine learning to uncover novel molecular subtypes, prognostic markers, and insights into immunotherapy for melanoma.BMC Cancer. 2025 Apr 7;25(1):630. doi: 10.1186/s12885-025-14012-3. BMC Cancer. 2025. PMID: 40200221 Free PMC article.
-
SNAI1 promotes epithelial-mesenchymal transition and maintains cancer stem cell-like properties in thymic epithelial tumors through the PIK3R2/p-EphA2 Axis.J Exp Clin Cancer Res. 2024 Dec 19;43(1):324. doi: 10.1186/s13046-024-03243-0. J Exp Clin Cancer Res. 2024. PMID: 39702326 Free PMC article.
-
Prognostic value of EMT-related genes and immune cell infiltration in thyroid carcinoma.Front Immunol. 2024 Nov 4;15:1463258. doi: 10.3389/fimmu.2024.1463258. eCollection 2024. Front Immunol. 2024. PMID: 39559351 Free PMC article.
-
Multi-omics in exploring the pathophysiology of diabetic retinopathy.Front Cell Dev Biol. 2024 Dec 11;12:1500474. doi: 10.3389/fcell.2024.1500474. eCollection 2024. Front Cell Dev Biol. 2024. PMID: 39723239 Free PMC article. Review.
-
Application of machine learning for mass spectrometry-based multi-omics in thyroid diseases.Front Mol Biosci. 2024 Dec 17;11:1483326. doi: 10.3389/fmolb.2024.1483326. eCollection 2024. Front Mol Biosci. 2024. PMID: 39741929 Free PMC article. Review.
References
-
- Sung H, Ferlay J, Siegel RL, Laversanne M, Soerjomataram I, Jemal A, et al. Global cancer statistics 2020: GLOBOCAN estimates of incidence and mortality worldwide for 36 cancers in 185 countries. CA Cancer J Clin. 2021;71(3):209–49. - PubMed
-
- Gou Q, Gao L, Nie X, Pu W, Zhu J, Wang Y, et al. Long noncoding RNA AB074169 inhibits cell proliferation via modulation of KHSRP-mediated CDKN1a expression in papillary thyroid carcinoma. Can Res. 2018;78(15):4163–74. - PubMed
MeSH terms
Substances
Grants and funding
- (No. 2023SKY120)/Shaoxing Health Science and Technology Plan Project
- (Grant No. 2023YW095)/Zhuji Medical and Health Science and Technology Plan Project
- (No. 2022QD048)/The Doctoral Research Initiation Fund of the First Affiliated Hospital of Wenzhou Medical University
- (No. 2023RC293)/Zhejiang Medical and Health Science and Technology Plan Project
LinkOut - more resources
Full Text Sources
Medical
Research Materials
Miscellaneous
