. 2024 Oct;46(5):4185-4202.
doi: 10.1007/s11357-024-01167-3. Epub 2024 Jun 13.

A Fully-Automated Senescence Test (FAST) for the high-throughput quantification of senescence-associated markers

Affiliations

A Fully-Automated Senescence Test (FAST) for the high-throughput quantification of senescence-associated markers

Francesco Neri et al. Geroscience. 2024 Oct.

Abstract

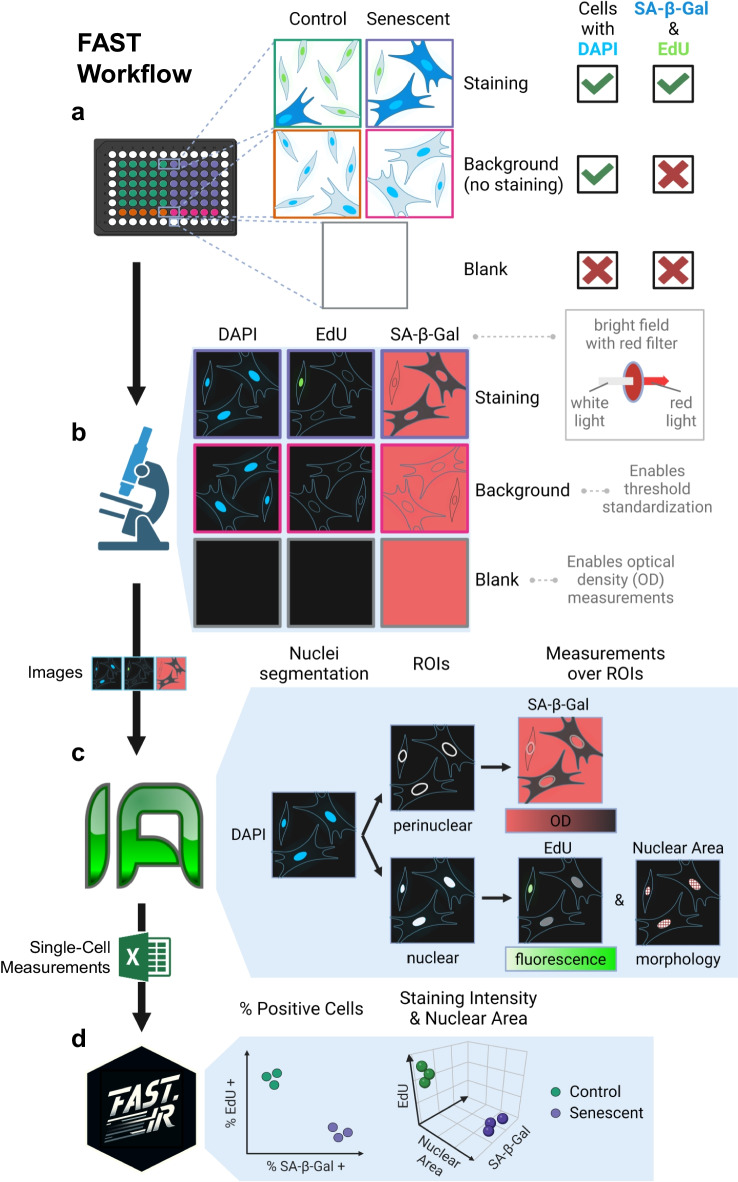
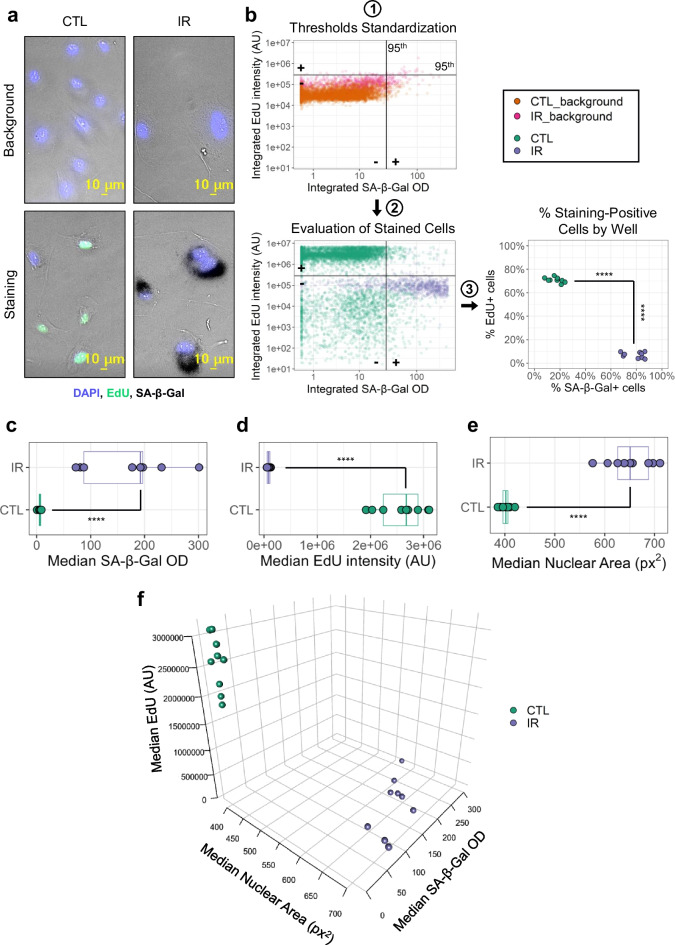
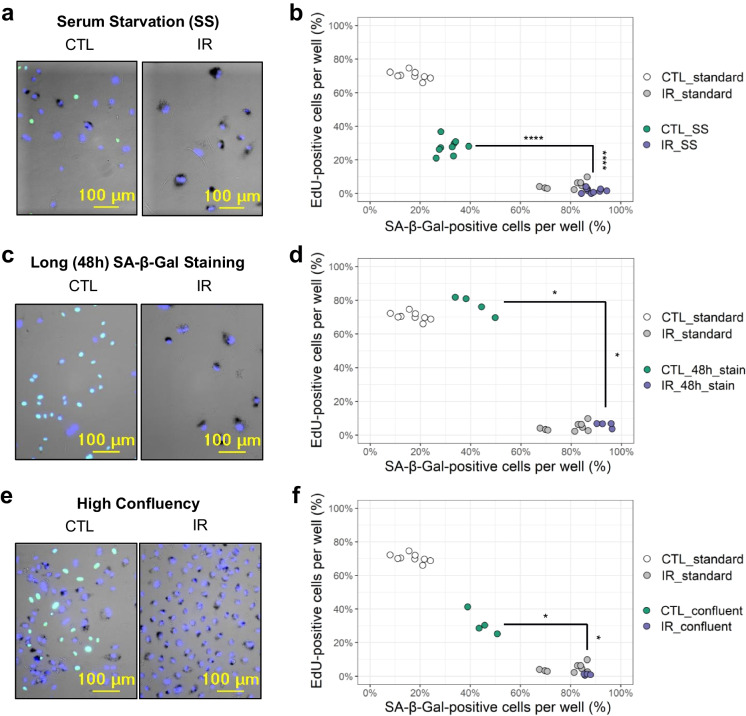
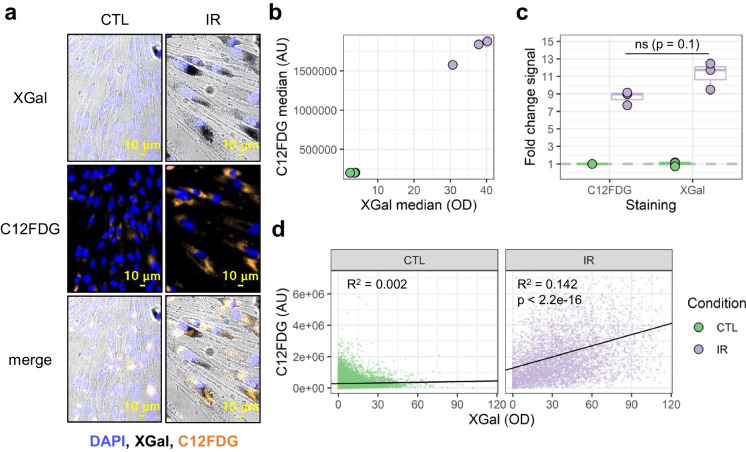
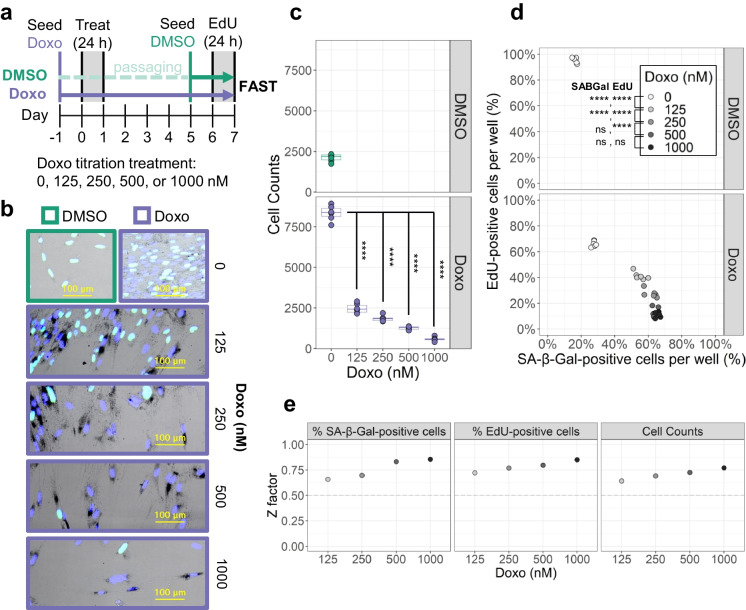
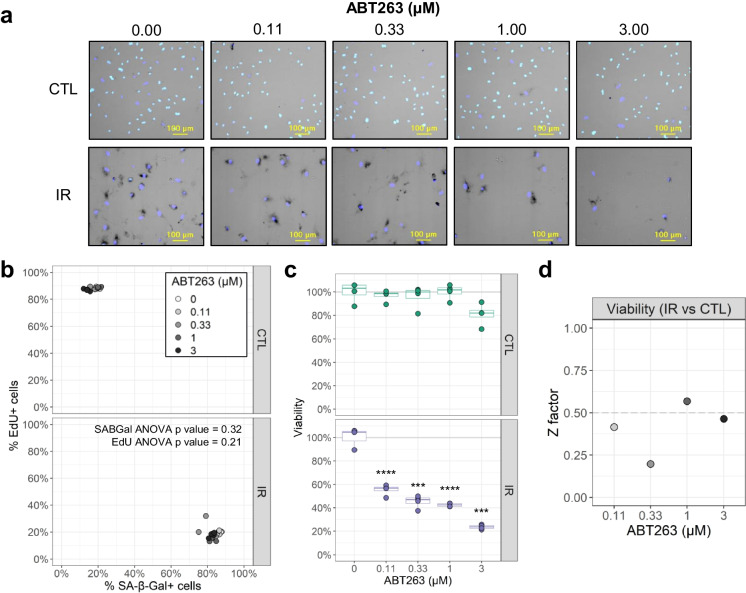
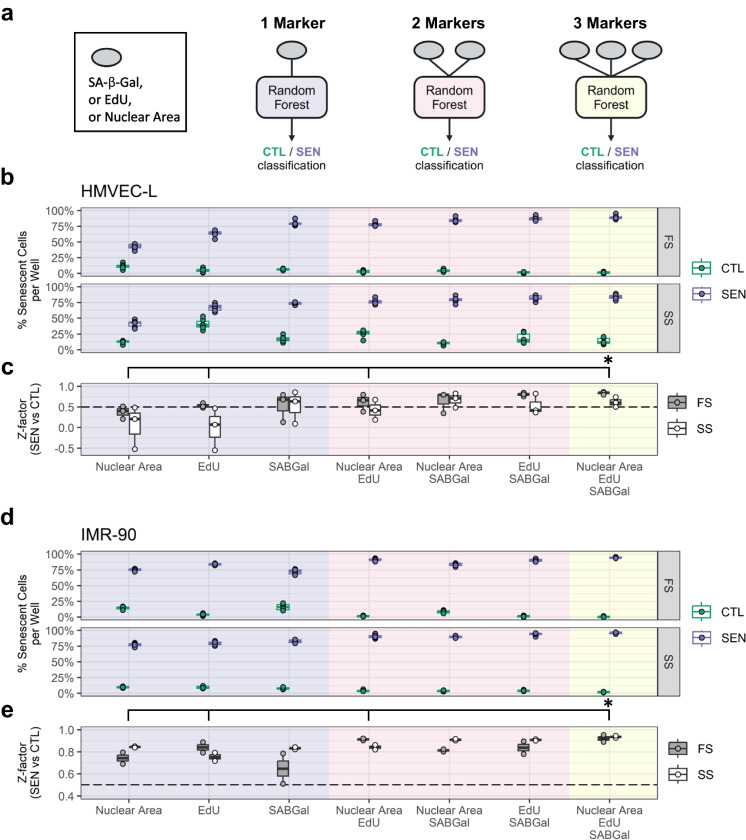
Cellular senescence is a major driver of aging and age-related diseases. Quantification of senescent cells remains challenging due to the lack of senescence-specific markers and generalist, unbiased methodology. Here, we describe the Fully-Automated Senescence Test (FAST), an image-based method for the high-throughput, single-cell assessment of senescence in cultured cells. FAST quantifies three of the most widely adopted senescence-associated markers for each cell imaged: senescence-associated β-galactosidase activity (SA-β-Gal) using X-Gal, proliferation arrest via lack of 5-ethynyl-2'-deoxyuridine (EdU) incorporation, and enlarged morphology via increased nuclear area. The presented workflow entails microplate image acquisition, image processing, data analysis, and graphing. Standardization was achieved by (i) quantifying colorimetric SA-β-Gal via optical density; (ii) implementing staining background controls; and (iii) automating image acquisition, image processing, and data analysis. In addition to the automated threshold-based scoring, a multivariate machine learning approach is provided. We show that FAST accurately quantifies senescence burden and is agnostic to cell type and microscope setup. Moreover, it effectively mitigates false-positive senescence marker staining, a common issue arising from culturing conditions. Using FAST, we compared X-Gal with fluorescent C12FDG live-cell SA-β-Gal staining on the single-cell level. We observed only a modest correlation between the two, indicating that those stains are not trivially interchangeable. Finally, we provide proof of concept that our method is suitable for screening compounds that modify senescence burden. This method will be broadly useful to the aging field by enabling rapid, unbiased, and user-friendly quantification of senescence burden in culture, as well as facilitating large-scale experiments that were previously impractical.

Keywords: Aging; Cellular senescence; High-content image analysis; High-throughput screening; Machine learning; Senescence-associated-β-galactosidase.


Conflict of interest statement

J.C. was a founder and shareholder of Unity Biotechnology that develops senolytic drugs. A.A.G. has financial interest in Image Analyst Software. All other authors declare no conflict of interest.

Figures

Fig. 1
Fig. 1
FAST workflow. a For each condition (e.g., Control and Senescent), cells are given substrates for SA-β-Gal and EdU staining (Staining) or vehicle (Background). All cell wells are DAPI-stained. Some wells do not contain any cells (Blank). b Automated image acquisition is performed to capture nuclear counterstain DAPI (blue channel), EdU staining (green channel), and SA-β-Gal (bright field, BF). The use of a red wavelength emission filter (690 nm) for BF imaging results in SA-β-Gal crystals appearing as dark pixels. In combination with the acquisition of Blank images, this modified BF imaging enables optical density (OD) measurements of SA-β-Gal staining. c Image analysis in Image Analyst MKII. DAPI images are segmented, resulting in nuclear and perinuclear labels, which are used to measure integrated intensities of EdU, nuclear areas, and integrated ODs of SA-β-Gal, respectively. d Single-cell measurements are analyzed and graphed with FAST.R, a custom R Shiny application. ROI: region of interest
Fig. 2
Fig. 2
Standardization of detection. a Representative images of primary human microvasculature endothelial cells. Top panels show background cells, while bottom panels show stained cells; left panels show non-senescent cells (CTL), right panels show ionizing radiation-induced senescent cells (IR). b Standardized thresholding for percentage staining calculation. (1) Signal thresholds are generated based on the 95th percentile in SA-β-Gal and EdU staining measurements of background cells. (2) Signal thresholds are then used to establish SA-β-Gal and EdU positivity in stained cells. (3) The percentage of EdU- and SA-β-Gal-positive cells is calculated for each well. 12: each dot corresponds to one cell in a representative microplate (n cells: CTL = 6359, CTL background = 5012, IR = 1183, IR background = 884). 3: each dot corresponds to one well (n = 9) from the same plate. c–e Boxplots with median well values for SA-β-Gal staining (c), EdU staining (d), and nuclear area (e). Each dot corresponds to one well in the same microplate (n = 9). f 3D scatterplot showing all 3 measured variables for each well (n = 9). ****p < 0.0001 by Mann-Whitney test
Fig. 3
Fig. 3
FAST distinguishes senescent cell populations in experimental settings with high rate of false positives. a Representative images of serum-starved (SS) non-senescent (CTL) and ionizing radiation-induced senescent (IR) endothelial cells. b Quantification of a showing percentages of SA-β-Gal- and EdU-positive cells grouped by well. Both SS and full-serum (standard) samples are shown. Each dot is a well (n = 9) in a representative microplate of 3 independent experiments. c Representative images of CTL and IR endothelial cells with prolonged SA-β-Gal staining (48 h). d Quantification of c with percentages of SA-β-Gal- and EdU-positive cells grouped by well. Both samples with prolonged staining (48 h stain) and standard overnight staining (standard) are shown. Each dot is a well (n wells: CTL and IR 48h stain = 4, CTL and IR standard = 9). e Representative images of CTL and IR endothelial cells at high confluency. f Quantification of e with percentages of SA-β-Gal- and EdU-positive cells grouped by well. Both samples at high confluency (confluent) and low confluency (standard) are shown. Each dot is a well (n wells: CTL and IR confluent = 4, CTL and IR standard = 9). *p < 0.05; ****p < 0.0001 by Mann-Whitney test
Fig. 4
Fig. 4
Comparison of colorimetric X-Gal and fluorescent C12FDG live cell staining with FAST. a Representative images of non-senescent (CTL) and ionizing radiation-induced senescent (IR) IMR-90 fibroblasts. Live cells were stained with fluorescent C12FDG and imaged, followed by fixation, staining with colorimetric X-Gal, and subsequent re-imaging of the same view fields. b Scatterplot with median signal of X-Gal and C12FDG for each well (n = 3). c Boxplot showing the fold change in median signal intensity of IR wells relative to CTL (n wells = 3). The p-value was calculated by the Mann-Whitney test. d Scatterplots of single-cell staining intensities for X-Gal versus C12FDG in CTL (left) and IR (right) conditions. Fitted linear regression models are indicated by solid black lines; n cells: CTL = 22601, IR = 5198
Fig. 5
Fig. 5
Benchmarking FAST with senescence induction. a Experimental design to test senescence induction with a given compound, in this case, the known senescence inducer doxorubicin (Doxo). b Representative images of primary human IMR-90 fibroblasts treated with different concentrations of Doxo. c Cell counts per well for each Doxo concentration (n wells = 6). d Percentage of SA-β-Gal- and EdU-positive cells per well for each Doxo concentration. Each dot is a well (n = 6). e Z-factor calculations across different metrics: percentage of SA-β-Gal-positive cells, percentage of EdU-positive cells, and cell counts per well. SA-β-Gal and EdU percentages for each Doxo concentration are compared to the DMSO condition. Cell counts for each Doxo concentration are compared to the (8-day cultured) Doxo 0 nM condition. ns, adjusted-p > 0.05; ****adjusted-p < 0.0001 by Tukey’s test after significant (p < 0.05) one-way ANOVA
Fig. 6
Fig. 6
Benchmarking FAST with a senolytic compound. a Representative images of senescent HMVEC-L cells treated with different concentrations of the senolytic compound ABT263 for 24 h. CTL: non-senescent cells, IR: ionizing radiation-induced senescent cells. b Percentage of SA-β-Gal- and EdU-positive cells per well for all ABT263 concentrations (n = 4 wells). c Percentage of viable cells based on cell counts per well normalized to vehicle (0 μM ABT263) group (n = 4 wells). Comparison of viability between CTL and IR cells for each ABT263 concentration: ***adjusted-p < 0.001; ****adjusted-p <0 .0001 by Bonferroni-Dunn test. d Z-factor calculations for viability measurements at each ABT263 concentration. For each ABT263 concentration, the viability of IR cells was compared to the viability of CTL cells treated with the same senolytic concentration
Fig. 7
Fig. 7
Combination of markers using machine learning improves repeatability of senescence detection. a Conceptual scheme for machine learning classifiers. In each replicate microplate, 6 non-senescent (CTL) and 6 IR senescent wells (SEN) including both serum conditions were randomly selected for model training, and the remaining wells were used for the data shown. For each training dataset, random forest classifiers were trained using the indicated combinations of the measured senescence markers (SA-β-Gal, EdU, and nuclear area). b Percentage of cells classified as senescent in CTL (green) and SEN (purple) test wells by each model in HMVEC-L endothelial cells in either full-serum (FS) or serum-starved conditions (SS). Representative of 3 experiments, dots are technical replicate wells (n = 6). c Z-factors comparing SEN and CTL in b for both FS (grey) and SS conditions (white). Dots are independent experiments (n = 3). d, e Senescence classification in IMR-90 fibroblasts as described (b and c), using n = 6 well replicates in d and n = 2 experimental replicates in e. *p < 0.05 using two-way repeated-measures ANOVA with Dunnett’s multiple comparison test comparing to the triple marker classifier. For this, all data from c and e were pooled and accounted for repeated use of the same data with multiple classifiers. While cell type and serum condition did not have a significant effect, the Z-factors significantly varied between the used ML models

Update of

Similar articles

Cited by

References

    1. Gorgoulis V, et al. Cellular senescence: defining a path forward. Cell. 2019;179:813–27. 10.1016/j.cell.2019.10.005 - DOI - PubMed
    1. Harley CB, Futcher AB, Greider CW. Telomeres shorten during ageing of human fibroblasts. Nature. 1990;345:458–60. 10.1038/345458a0 - DOI - PubMed
    1. Bodnar AG, et al. Extension of life-span by introduction of telomerase into normal human cells. Science. 1998;279:349–52. 10.1126/science.279.5349.349 - DOI - PubMed
    1. Leonardo AD, Linke SP, Clarkin K, Wahl GM. DNA damage triggers a prolonged p53-dependent G1 arrest and long-term induction of Cip1 in normal human fibroblasts. Genes Dev. 1994;8:2540–51. 10.1101/gad.8.21.2540 - DOI - PubMed
    1. Serrano M, Lin AW, McCurrach ME, Beach D, Lowe SW. Oncogenic ras provokes premature cell senescence associated with accumulation of p53 and p16INK4a. Cell. 1997;88:593–602. 10.1016/S0092-8674(00)81902-9 - DOI - PubMed

MeSH terms

LinkOut - more resources