. 2024 Jun 13;40(1):47.
doi: 10.1007/s10565-024-09874-5.

LncRNA KIFAP3-5:1 inhibits epithelial-mesenchymal transition of renal tubular cell through PRRX1 in diabetic nephropathy

Affiliations

LncRNA KIFAP3-5:1 inhibits epithelial-mesenchymal transition of renal tubular cell through PRRX1 in diabetic nephropathy

Lei Du et al. Cell Biol Toxicol. .

Abstract

Long noncoding RNAs play an important role in several pathogenic processes in diabetic nephropathy, but the relationship with epithelial-mesenchymal transition in DN is unclear. Herein, we found that KIFAP3-5:1 expression was significantly down-regulated in DN plasma samples, db/db mouse kidney tissues and high glucose treated renal tubular epithelial cells compared to normal healthy samples and untreated cells. Overexpression of KIFAP3-5:1 improved renal fibrosis in db/db mice and rescued epithelial-mesenchymal transition of high glucose cultured renal tubular epithelial cells. The silence of KIFAP3-5:1 will exacerbate the progression of EMT. Mechanistically, KIFAP3-5:1 was confirmed to directly target to the -488 to -609 element of the PRRX1 promoter and negatively modulate PRRX1 mRNA and protein expressions. Furthermore, rescue assays demonstrated that the knockdown of PRRX1 counteracted the KIFAP3-5:1 low expression-mediated effects on EMT in hRPTECs cultured under high glucose. The plasma KIFAP3-5:1 of DN patients is highly correlated with the severity of renal dysfunction and plays an important role in the prediction model of DN diseases. These findings suggested that KIFAP3-5:1 plays a critical role in regulation of renal EMT and fibrosis through suppress PRRX1, and highlight the clinical potential of KIFAP3-5:1 to assist in the diagnosis of diabetic nephropathy.

Keywords: Diabetic nephropathy; EMT, renal fibrosis; KIFAP3-5:1; PRRX1.


Conflict of interest statement

The authors have no relevant financial or non-financial interests to disclose.

Figures
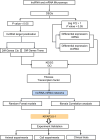
Fig. 1
Fig. 1
Schema of the study
Fig. 2
Fig. 2
Differentially expressed lncRNAs in DN patients (a, c) Volcano plot of lncRNA and mRNA. Upregulated, red; downregulated, blue. (b, d) An expression heatmap of differentially expressed lncRNAs and mRNAs. Upregulated, red; downregulated, blue. (e, f) Differential expression of lncRNAs predicted by cis and trans mRNA. (g, h) The KEGG and GO analysis of differentially expressed lncRNA and mRNA. (i) The mRNAs enriched in transcriptional regulation and fibrosis related pathways. (j) The lncRNA corresponding to cis and trans predictions of enriched mRNA in Fig. 2 i
Fig. 3
Fig. 3
Differential expression of lncRNA related to fibrosis in DN (a) The Venn plot of predicted lncRNAs and differentially expressed lncRNAs related to fibrosis and transcriptional regulation. (b) The expression levels of 4 differentially expressed lncRNAs related to transcriptional regulation and fibrosis were determined by taking the intersection from the Venn plot in Fig. 3a. (c) Transcriptional regulation and fibrosis related lncRNA and mRNA correlation network. (d) Expression levels of four differentially expressed lncRNAs related to fibrosis and transcriptional regulation in plasma of patients with an expanded clinical cohort. (e) The correlation network between target genes of 4 lncRNAs and expression levels of fibrosis indicator genes. (f) The Variable Importance and ROC Curve of Four lncRNAs in Random Forest Model. (g) The ROC curve analysis of 4 lncRNAs. *P < 0.05, **P < 0.01, ***P < 0.005, ****P < 0.001,DN compared with NC. ##P < 0.01, DN compared with DM
Fig. 4
Fig. 4
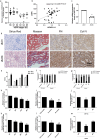
The expression and characterization of KIFAP3-5:1 in vivo and in vitro and its correlation with EMT (a) KIFAP3-5:1 mRNA levels in different stages of DN. Data are expressed as the mean ± SEM, n = 45, *P < 0.05, **P < 0.01 vs NC. (b) Linear regression shows a positive correlation between plasma KIFAP3-5:1 mRNA levels and kidney function (eGFR), n = 45. (c) Level of KIFAP3-5:1 mRNA expression level in db/m and db/db mice. Data are expressed as the mean ± SEM,n = 6, *P < 0.05, **P < 0.01 vs db/m. (d) Morphology and fibrosis in db/db mice. Sirius red staining, Masson, FN and Col IV of kidney tissues; shown are representative images from 6 mice per group. (e) Quantifications of positive region from different groups of mice. (f, g) The expression level of KIFAP3-5:1 in cytoplasm and nuclei of HG-treated hRPTECs and mRTECs, respectively. 18 s (cytoplasm retained) and U1 (nuclear retained) were used as controls. (h, k) mRNA expressions of KIFAP3-5:1 in hRPTECs and mRTEC cells exposed to 30 mmol/L glucose for (0, 12, 24, 48 h). (i, l) mRNA expression of KIFAP3-5: 1 in hRPTECs and mRTECs exposed to 5.56 mmol/L, 15 mmol/L, and 30 mmol/L glucose for 48 h. (j, m) mRNA expressions of KIFAP3-5:1 in hRPTECs and mRTECs exposed to 30 mmol/L high glucose and mannitol. Data are expressed as the mean ± SEM, n = 3. *P < 0.05, **P < 0.01. HG compared with NG. 12 h, 24 h, 48 h compared with 0 h. #P < 0.05, ##P < 0.01, 15 mM,30 mM,60 mM compared with 5.56 mM. NG: normal glucose group (5.56 mM), HG: high glucose group (30 mM), MA: mannitol group (30 mM)
Fig. 5
Fig. 5
Effect of KIFAP3-5:1 on EMT induced by high glucose in human and murine renal tubular epithelial cell (a,b, c) The relative protein levels of EMT-associated proteins in hRPTECs. (d, e, f) The relative protein levels of EMT-associated proteins in mRTECs. (g, h) Distribution and expressions of E-cadherin, Vimentin, ZO-1 and α-SMA in hRPTECs cells by immunofluorescence (bar = 20 μm). Data are expressed as the mean ± SEM, n = 3. *P < 0.05, **P < 0.01 vs NG/sh-Control, #P < 0.05, ##P < 0.01 compared with HG/sh-Control. NG/sh-Control: cells were transfected with the control lentivirus vector. NG/shKIFAP3-5:1: cells were transfected with KIFAP3-5:1 shRNA lentivirus vector. HG/LV-Control: cells were transfected with the control lentivirus vector. HG/LV-KIFAP3-5:1: cells were transfected with KIFAP3-5:1 overexpressed lentivirus vector
Fig. 6
Fig. 6
The effects of KIFAP3-5:1 on EMT of renal tubular epithelial cells through PRRX1 (a) The relative protein levels of PRRX1 in hRPTECs. (b) The protein expression of PRRX1 regulated by KIFAP3-5:1 lentivirus or its shRNA. (c) The mRNA expression of PRRX1 regulated by KIFAP3-5:1 lentivirus or its shRNA. (d) Schematic representation of luciferase construct of PRRX1 promoter and the mutation sites of − 609/ − 488 and − 315/ − 248 binding sites. (e) Dual-luciferase reporter assay was performed to measure the luciferase activity in hRPTECs Co-transfection of control or KIFAP3-5:1 overexpressed lentivirus and pGL3-PRRX1 with or without mutations. Data are mean ± SEM. n = 3. *P < 0.05, **P < 0.01 compared with wt NC group; #P < 0.05, ##P < 0.01 compared with mut2 NC group. (f, g, h, i) The relative protein levels of EMT-related protein in hRPTECs infected with control or LV-shKIFAP3-5:1 lentiviral particles in addition to PRRX1 siRNAs or control, followed by treatment with HG. Data are expressed as the mean ± SEM, n = 3. &P < 0.05, && P < 0.01 compared with NG + siPRRX1-veh, *P < 0.05, ** P < 0.01 compared with HG + siPRRX1-veh, #P < 0.05, ##P < 0.01 compared with LV-shKIFAP3-5:1 + siPRRX1-veh, ns: no significant difference
Fig. 7
Fig. 7
Effect of KIFAP3-5:1 on renal function and renal interstitial fibrosis in db/db mice (a, b, c, d, e, f) Graphic presentation shows (a) blood urea nitrogen (BUN) levels, (b) NAG, (c) urinary protein, (d) β2-MG, (e) urinary albumin. (f) urinary microalbumin in different groups as indicated. (g, h, i, j) HE, PAS (h), Masson (i) and Sirius red staining (j) of renal cortex sections of mice. Scale bar = 20 μm. (k, l)The relative protein levels of EMT-associated proteins in mice. Data are expressed as the mean ± SEM, n = 6. *P < 0.05, **P < 0.01 compared with db/m. #P < 0.05, ##P < 0.01 compared with db/db + LV-Control. db/m: normal mice group, db/db: diabetic mice group, db/db + LV-Control: Lnc-KIFAP3-5:1 overexpression control group. db/db + LV-KIFAP3-5:1: Lnc-KIFAP3-5:1 overexpression lentivirus-injected group
Fig. 8
Fig. 8
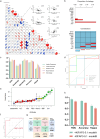
Plasma KIFAP3-5:1 is a potential new biomarker of DN in Humans (a) Correlation analysis between KIFAP3-5:1 and clinical indicators. (b) The distribution of missing values in the variables of the clinical cohort dataset. (c) Comparison of model performance among 5 different algorithms. (d) The ROC curves of 5 different algorithms. (e) The variable importance ranking determined by Boruta algorithm. The blue boxplot corresponds to the Z score of a shadow feature; the red and green boxplots represent the Z scores of rejected and confirmed features, respectively; and the yellow color indicates the Z scores of tentative features. (f) The ROC curves of the model constructed using the optimal algorithm after feature selection. (g) The confusion matrix of the new model constructed using the optimal algorithm after feature selection. (h) The comparison of performance between Model A containing KIFAP3-5:1 and Model B without the variable KIFAP3-5:1

Similar articles

Cited by

References

    1. Block CJ, Mitchell AV, Wu L, Glassbrook J, Craig D, Chen W, Dyson G, DeGracia D, Polin L, Ratnam M, Gibson H, Wu G. RNA binding protein RBMS3 is a common EMT effector that modulates triple-negative breast cancer progression via stabilizing PRRX1 mRNA. Oncogene. 2021;46:6430–42. 10.1038/s41388-021-02030-x. - PMC - PubMed
    1. Bosada FM, Rivaud MR, Uhm JS, Verheule S, van Duijvenboden K, Verkerk AO, Christoffels VM, Boukens BJ. A variant noncoding region regulates prrx1 and predisposes to atrial arrhythmias. Circ Res. 2021;3:420–34. 10.1161/CIRCRESAHA.121.319146. - PubMed
    1. Bridoux F, Leung N, Belmouaz M, Royal V, Ronco P, Nasr SH, Fermand JP. Management of acute kidney injury in symptomatic multiple myeloma. Kidney Int. 2021;3:570–80. 10.1016/j.kint.2020.11.010. - PubMed
    1. Chen Z, Chen Y, Li Y, Lian W, Zheng K, Zhang Y, Zhang Y, Lin C, Liu C, Sun F, Sun X, Wang J, Zhao L, Ke Y. Prrx1 promotes stemness and angiogenesis via activating TGF-beta/smad pathway and upregulating proangiogenic factors in glioma. Cell Death Dis. 2021;6:615. 10.1038/s41419-021-03882-7. - PMC - PubMed
    1. Chen T, Guo Y, Wang J, Ai L, Ma L, He W, Li Z, Yu X, Li J, Fan X, Gu Y, Liang H. LncRNA CTD-2528L19.6 prevents the progression of IPF by alleviating fibroblast activation. Cell Death Dis. 2021;6:600. 10.1038/s41419-021-03884-5. - PMC - PubMed

Publication types

MeSH terms