. 2024 Jul;13(7):1683-1701.
doi: 10.1007/s40121-024-01001-5. Epub 2024 Jun 13.

Cross-Sectional Survey of Factors Contributing to COVID-19 Testing Hesitancy Among US Adults at Risk of Severe Outcomes from COVID-19

Affiliations

Cross-Sectional Survey of Factors Contributing to COVID-19 Testing Hesitancy Among US Adults at Risk of Severe Outcomes from COVID-19

Annlouise R Assaf et al. Infect Dis Ther. 2024 Jul.

Abstract

Introduction: The United States Centers for Disease Control and Prevention (CDC) advises testing individuals for COVID-19 after exposure or if they display symptoms. However, a deeper understanding of demographic factors associated with testing hesitancy is necessary.

Methods: A US nationwide cross-sectional survey of adults with risk factors for developing severe COVID-19 ("high-risk" individuals) was conducted from August 18-September 5, 2023. Objectives included characterizing demographics and attitudes associated with COVID-19 testing. Inverse propensity weighting was used to weight the data to accurately reflect the high-risk adult US population as reflected in IQVIA medical claims data. We describe here the weighted results modeled to characterize demographic factors driving hesitancy.

Results: In the weighted sample of 5019 respondents at high risk for severe COVID-19, 58.2% were female, 37.8% were ≥ 65 years old, 77.1% were White, and 13.9% had a postgraduate degree. Overall, 67% were Non-testers (who indicated that they were unlikely or unsure of their likelihood of being tested within the next 6 months); these respondents were significantly more likely than Testers (who indicated a higher probability of testing within 6 months) to be female (60.2 vs. 54.1%; odds ratio [OR] [95% confidence interval (CI)], 1.3 [1.1‒1.4]), aged ≥ 65 years old (41.5 vs. 30.3%; OR [95% CI] compared with ages 18‒34 years, 0.6 [0.5‒0.7]), White (82.1 vs. 66.8%; OR [95% CI], 1.4 [1.1‒1.8]), and to identify as politically conservative (40.9 vs. 18.1%; OR [95% CI], 2.6 [2.3‒2.9]). In contrast, Testers were significantly more likely than Non-testers to have previous experience with COVID-19 testing, infection, or vaccination; greater knowledge regarding COVID-19 and testing; greater healthcare engagement; and concerns about COVID-19.

Conclusions: Older, female, White, rural-dwelling, and politically conservative high-risk adults are the most likely individuals to experience COVID-19 testing hesitancy. Understanding these demographic factors will help guide strategies to improve US testing rates.

Keywords: COVID-19; Risk factors; SARS-CoV-2; Survey; Testing.


Conflict of interest statement

Annlouise R. Assaf, Gurinder Sidhu, Joseph C. Cappelleri, Florin Draica, Iqra Arham, Mehnaz Bader, Camille Jimenez, Michael Bois, and Stephen Watt are employees of Pfizer and may hold stock or stock options. Apurv Soni and Carly Herbert have no conflicts of interest to declare. Eliza Silvester, Jessica Meservey, Valerie Eng, Megan Nelson, Yong Cai, Aakansha Nangarlia, Zhiyi Tian, and Yanping Liu are employees of IQVIA, which received funding from Pfizer to perform analyses for the study.

Figures
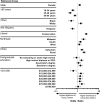
Fig. 1
Fig. 1
Likelihood of testing hesitancy across demographic characteristics. Filled circles represent odds ratios, and error bars represent 95% CIs. Where the reference group is listed as “other” race, it encompasses all respondents who indicated any race other than White (where White is the test group) or Black (where Black is the test group). For the purposes of analysis, those who described their politics as “Very liberal,” “Liberal,” or “Somewhat liberal” were grouped into a single “Liberal” category, and those who described their politics as “Very conservative,” “Conservative,” or “Somewhat conservative” were grouped into a single “Conservative” category. Likewise, those who indicated their highest level of education as “Master’s Degree,” “Professional Degree,” or “Doctorate” were grouped into a single category of all postgraduate degrees. GED General Educational Development Test
Fig. 2
Fig. 2
Associations between COVID-19 testing hesitancy and self-reported knowledge of COVID-19‒related topics among survey respondents. Potential responses were “not at all knowledgeable” or “un-knowledgeable” (combined for analysis as a single “Not knowledgeable” category); “somewhat knowledgeable;” or “knowledgeable” or “extremely knowledgeable” (combined for analysis as a single “Proficient” category). ORs shown reflect comparisons between the likelihood of being a Non-tester within the “Not knowledgeable” versus the “Proficient” categories; for example, regarding Conditions associated with a high risk of severe COVID-19, those categorized as “Not knowledgeable” were 1.3 times more likely to be Non-testers compared with those categorized as “Proficient.” OR = odds ratio
Fig. 3
Fig. 3
Associations between COVID-19 testing hesitancy and previous experience with COVID-19 among survey respondents. Respondents were asked whether they A had been tested for SARS-CoV-2 in the past 12 months, B had ever been diagnosed with COVID-19 (for which in the analysis, responses of “not sure” were categorized along with “never”), C had ever been vaccinated against COVID-19, D had ever known someone who died due to COVID-19 (for which in the analysis, responses of “unsure” were categorized along with “does not know anyone who died from COVID-19”), and E had ever received treatment for COVID-19. OR = odds ratio
Fig. 4
Fig. 4
Associations between COVID-19 testing hesitancy and attitudes regarding COVID-19 among survey respondents. Respondents were asked: A “How worried are you about getting COVID-19?” and B “How much do you agree or disagree with the following statements?” Potential responses of “completely disagree,” “disagree,” “unsure,” “agree,” or “completely agree” were assigned a respective numeric value from 1 to 5 to calculate an average response value for Testers compared with Non-testers, and these values were compared using t tests. ***Denotes P < 0.001
Fig. 5
Fig. 5
Likelihood of testing hesitancy associated with different levels of healthcare system engagement. Filled circles represent odds ratios, and error bars represent 95% CIs. Respondents were asked: “About how often do you visit your provider that routinely provides you with healthcare (for example, your doctor/primary care physician, nurse practitioner, physician assistant)?”, “Did you speak with your doctor or other healthcare provider about your symptoms the last time you had COVID-19?” (only asked to those who indicated that they had COVID-19 in the past), and “Have you been hospitalized within the last 1 year?”

References

    1. World Health Organization. COVID-19 Dashboard. https://covid19.who.int/region/amro/country/us. Accessed 2 Oct 2023.
    1. World Health Organization. Statement on the fifteenth meeting of the IHR (2005) Emergency Committee on the COVID-19 pandemic. 2023.
    1. Ahmad FB, Cisewski JA, Xu J, Anderson RN. Provisional mortality data—United States, 2022. MMWR Morb Mortal Wkly Rep. 2023;72(18):488–492. doi: 10.15585/mmwr.mm7218a3. - DOI - PMC - PubMed
    1. El-Sadr WM, Vasan A, El-Mohandes A. Facing the new Covid-19 reality. N Engl J Med. 2023;388(5):385–387. doi: 10.1056/NEJMp2213920. - DOI - PubMed
    1. US Centers for Disease Control and Prevention. COVID Data Tracker. https://covid.cdc.gov/covid-data-tracker/#datatracker-home. Accessed 5 Dec 2023.

LinkOut - more resources