. 2024 Jun 13;134(15):e165814.
doi: 10.1172/JCI165814.

C16ORF70/MYTHO promotes healthy aging in C.elegans and prevents cellular senescence in mammals

Affiliations

C16ORF70/MYTHO promotes healthy aging in C.elegans and prevents cellular senescence in mammals

Anais Franco-Romero et al. J Clin Invest. .

Abstract

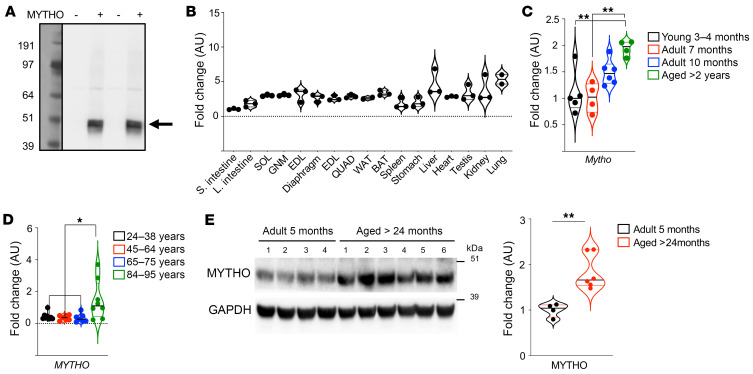
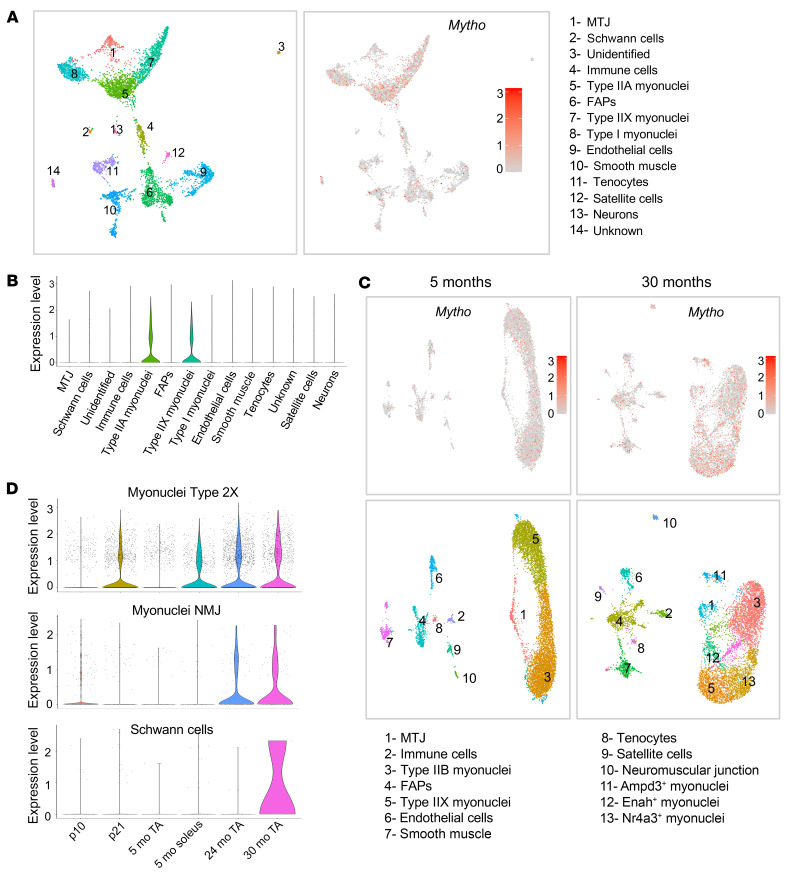
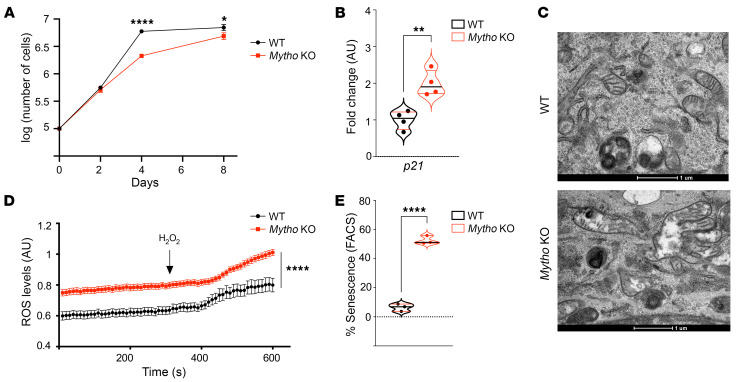
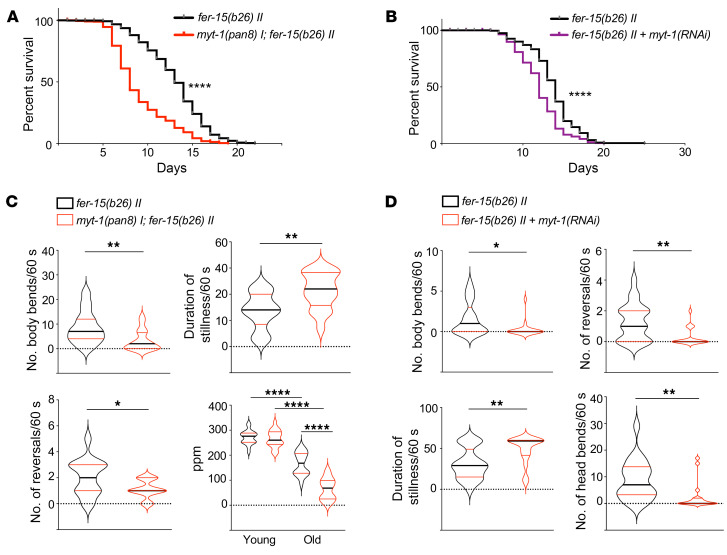
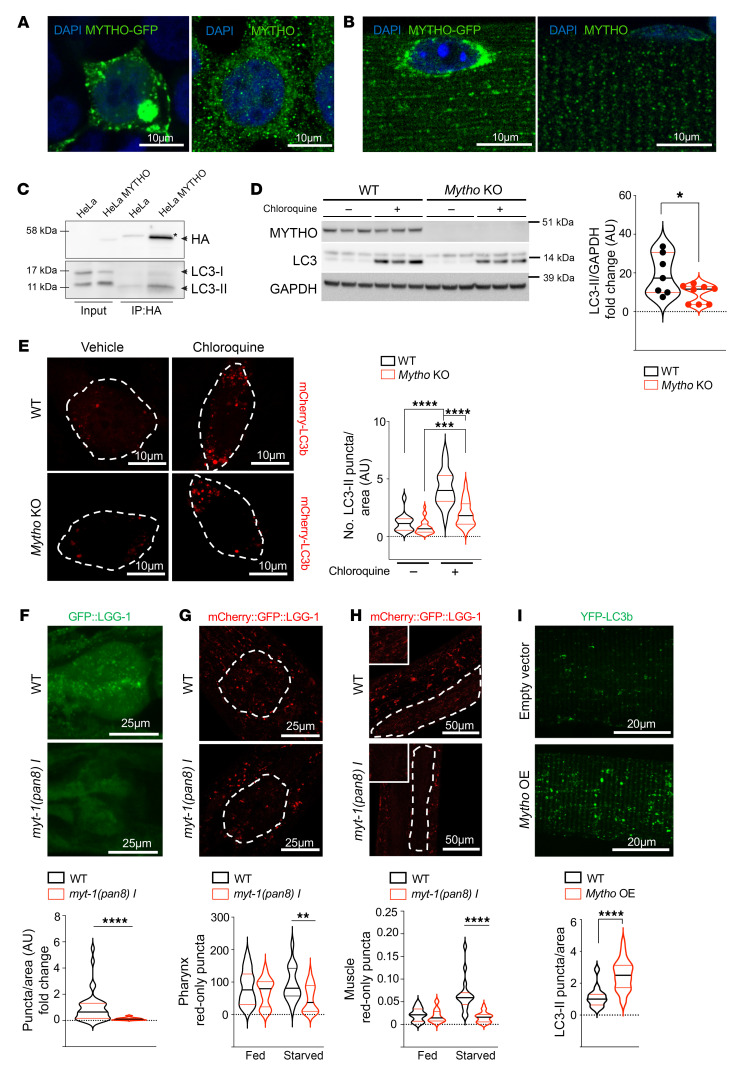
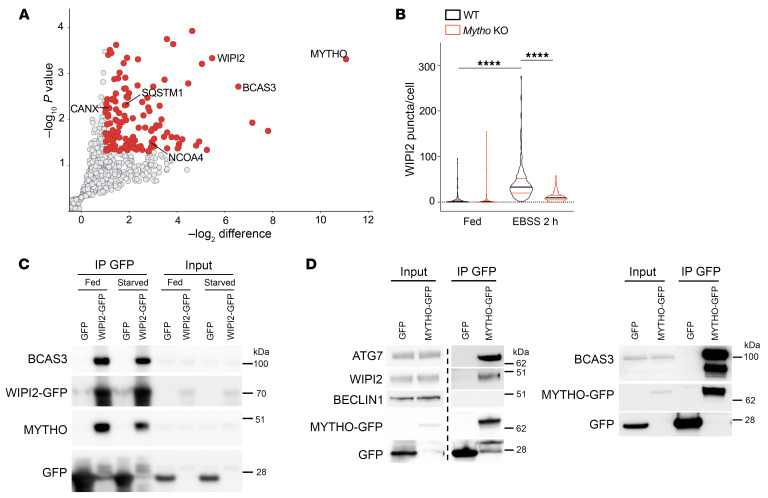
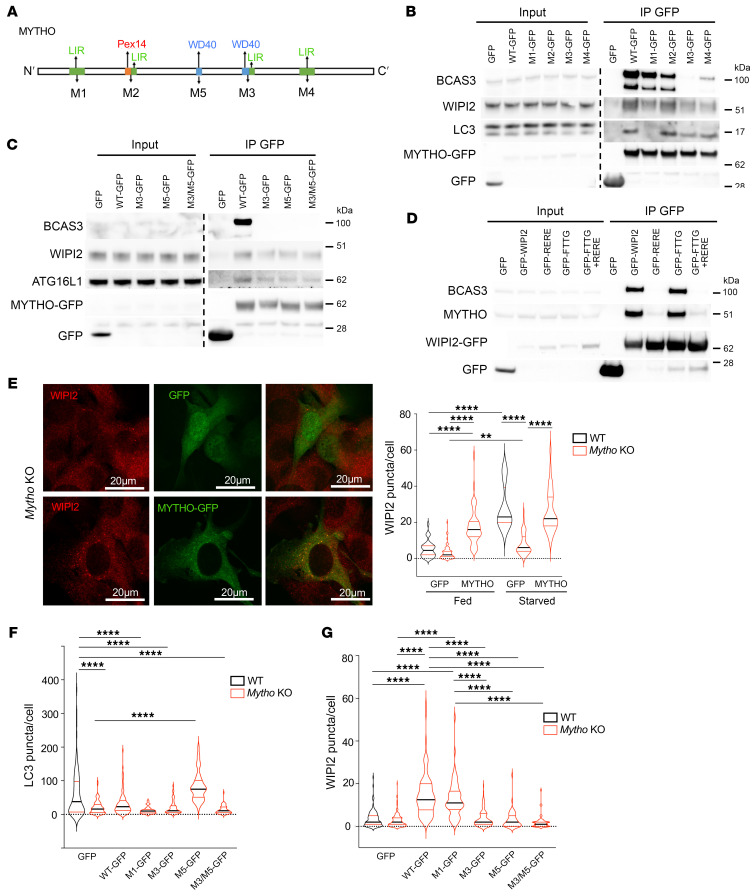
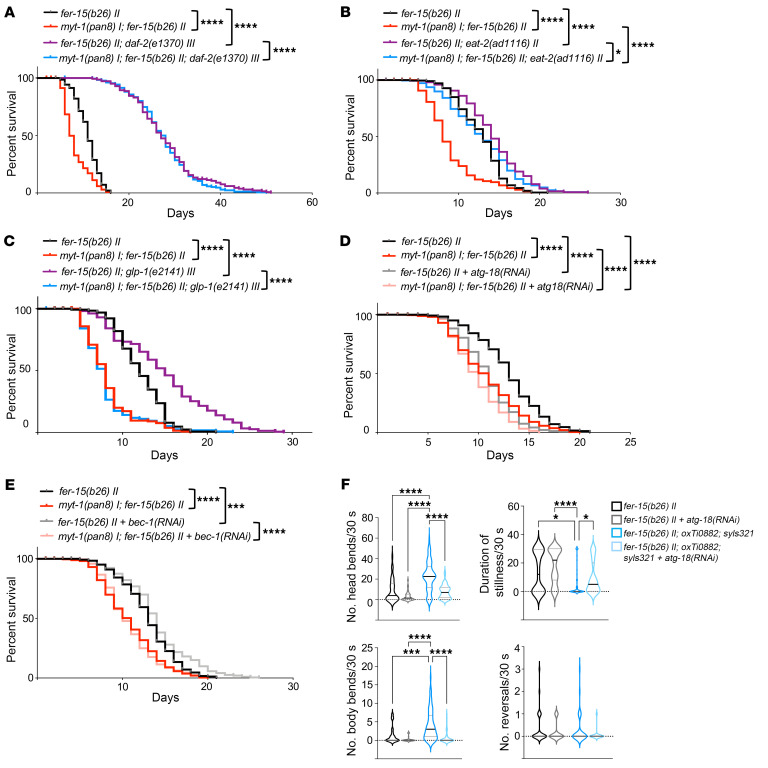
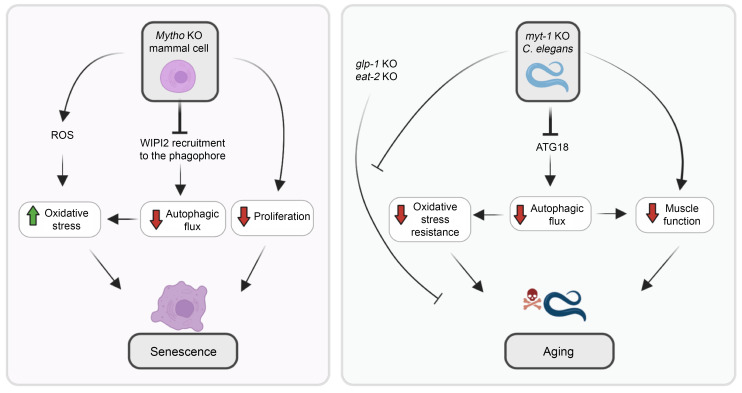
The identification of genes that confer either extension of life span or accelerate age-related decline was a step forward in understanding the mechanisms of aging and revealed that it is partially controlled by genetics and transcriptional programs. Here, we discovered that the human DNA sequence C16ORF70 encodes a protein, named MYTHO (macroautophagy and youth optimizer), which controls life span and health span. MYTHO protein is conserved from Caenorhabditis elegans to humans and its mRNA was upregulated in aged mice and elderly people. Deletion of the orthologous myt-1 gene in C. elegans dramatically shortened life span and decreased animal survival upon exposure to oxidative stress. Mechanistically, MYTHO is required for autophagy likely because it acts as a scaffold that binds WIPI2 and BCAS3 to recruit and assemble the conjugation system at the phagophore, the nascent autophagosome. We conclude that MYTHO is a transcriptionally regulated initiator of autophagy that is central in promoting stress resistance and healthy aging.

Keywords: Aging; Autophagy; Cell biology; Cellular senescence; Skeletal muscle.


Figures

Figure 1
Figure 1. C16orf70 encodes a protein named MYTHO that is expressed in different tissues and upregulated in aging.
(A) PBI-eGFP/3xFlag-MYTHO vector or PBI-eGFP/3xFlag–empty vector was transfected into HEK293A cells. 3×FLAG-MYTHO expression was observed using an anti-FLAG antibody. The blot shown in the image represents the results of 4 independent transfections. (B) Quantitative RT-PCR of Mytho in different organs and muscles from 5-month-old male mice. mRNA expression was calculated by the ΔCt method and expressed as fold increase from the tissue where Mytho is less expressed (small intestine). SOL, soleus muscle; GNM, gastrocnemius muscle; EDL, extensor digitorum longus muscle; TA, tibialis anterior muscle; QUAD, quadriceps muscle; WAT, white adipose tissue; BAT, brown adipose tissue. n = 3 for all tissues, n = 2 only for WAT and lung. (C) Quantitative real-time PCR of Mytho from mice of different ages (3–4 months, n = 5; 7 months, n = 4; 10 months, n = 6; and >2 years old, n = 4). Expression was normalized to that of Gapdh and is expressed as fold increase (1-way ANOVA with Tukey’s multiple-comparison test). (D) Quantitative real-time PCR of MYTHO in muscle biopsies from patients of different ages: 24–38 years old (n = 8), 45–64 years old (n = 7), 67–75 years old (n = 7), and 84–95 years old who underwent surgery for hip replacement (n = 8). All data were normalized to GAPDH and are expressed as fold increase from the 24- to 38-year-old control group (1-way ANOVA with Tukey’s multiple-comparison test). (E) Immunoblot of homogenates from GNM muscle from 5-month-old mice (n = 4) and >24-month-old (n = 6) mice. Anti-C16orf70 antibody was used to detect MYTHO endogenous protein. Normalization was performed using GAPDH and data are expressed as fold increase (2-tailed Student’s t test). All bars indicate SEM. *P < 0.05; **P < 0.01.
Figure 2
Figure 2. Mytho expression increases in muscle during aging.
snRNA-seq data re-elaborated from Myoatlas (https://research.cchmc.org/myoatlas/). (A) UMAP showing snRNA-seq expression of Mytho in different cell population from 5-month-old SOL muscle. MTJ, myotendinous junction; FAPs, fibro-adipogenic progenitors. (B) Violin plots with the quantification of Mytho expression in the different cell types. (C) UMAP of the different population of snRNA-seq showing Mytho expression at 5 months and 30 months. (D) Violin plots showing nuclear transcriptomic profiles of Mytho gene in myonuclei type 2X, myonuclei NMJ, and Schwann cells of animals at different ages (p10, postnatal day 10; p21, postnatal day 21; 5 mo, 5 months; 24 mo, 24 months; 30 mo, 30 months; TA, tibialis anterior).
Figure 3
Figure 3. Mytho depletion induces cellular senescence.
(A) The graph shows the logarithm (log) of total number of cells measured at 2 days, 4 days, and 8 days after seeding. Cellular confluence was reached at 4 and 8 days in control and Mytho-deficient cells, respectively (N = 3) (2-tailed Student’s t test). (B) Quantitative real-time PCR of p21 from WT and Mytho-KO C2C12 cells normalized to Gapdh and expressed as fold increase (N = 3) (2-tailed Student’s t test). (C) Representative electron microscopy images of the cytoplasm of WT (top) and Mytho-KO (bottom) C2C12 cells. Abnormal swollen mitochondria are often found in KO cells. Scale bars: 1 μm. (D) Mt-roGFP fluorescence was measured in single cells (n = 30/condition; N = 2). Arrow indicates the addition of H2O2. (E) Percentage senescence in cells measured by FACS after WT and Mytho-KO C2C12 cells were incubated with CellEvent Green Senescence Probe (Thermo Fisher Scientific) (n = 3) (multiple unpaired t test). N = number of independent experiments; n = total number of individuals. All bars indicate SEM. *P < 0.05, **P < 0.01, ****P < 0.0001.
Figure 4
Figure 4. Mytho depletion reduces C. elegans life span and health span.
(A) Survival curves of fer-15(b26) II and myt-1(pan8) I; fer-15(b26) II worms (n = 521, N = 5). (B) Survival curves of fer-15(b26) II worms fed with either bacteria transformed with pL4440 empty vector (n = 252) or with pL4440 containing the myt-1 coding sequence [myt-1(RNAi), n = 253] following a maternal RNAi protocol (see Methods) (N = 3). (C) Total number of body bends, reversals, and duration of stillness periods calculated for 5-day-old fer-15(b26) II (n = 15) and myt-1(pan8) I; fer-15(b26) II (n = 17) animals in spontaneous locomotion (N = 3). Pumping rate (pumps/minute) was assessed on day 1 (YOUNG, n = 20; n = 20) and day 5 (OLD, n = 19; n = 18) in fer-15(b26) II and myt-1(pan8) I; fer-15(b26) II animals (N = 2). (D) Spontaneous locomotion analysis of body and head bends, reversals, and duration of stillness periods in 11-day-old fer-15(b26) II animals fed with myt-1(RNAi) (n = 17) or control bacteria (n = 21) (N = 2). Log-rank (Mantel-Cox) test was used to compare longevity curves in A and B (see Supplemental Figure 6A for life span experimental details and statistics). Bars in C and D indicate SEM. *P < 0.05; **P < 0.01; ****P < 0.0001 (2-tailed Student’s t test). N = number of independent experiments; n = total number of individuals.
Figure 5
Figure 5. Depletion of Mytho reduces autophagic flux in vitro and in vivo.
(A) Left: Representative images of HEK293 cells transfected with MYTHO-GFP. Right: Representative image of endogenous MYTHO. Scale bars: 10 μm. (B) Left: FDB muscles transfected with MYTHO-GFP. Right: Endogenous Mytho in FDB fibers. Scale bars: 10 μm. (C) Endogenous HA-tagged Mytho coimmunoprecipitates with LC3B. The asterisk (*) indicates a nonspecific band. (D) LC3 lipidation was analyzed by immunoblot in WT and Mytho-KO C2C12 cells treated or not with chloroquine. LC3-II band was normalized to GAPDH (n = 8) (2-tailed Student’s t test). (E) Left: Representative fluorescence images of WT and Mytho-KO C2C12 cells transfected with Cherry-LC3B and treated with chloroquine or vehicle. Scale bars: 10 μm. Right: Quantification of LC3 puncta/area of the cell in each condition is shown (n > 15 cells/condition) (1-way ANOVA with Tukey’s multiple-comparison test). (F) Top: Representative fluorescence images of GFP:LGG-1 puncta in the posterior bulb of the pharynx of N2 (WT) and myt-1(pan8) I worms. Scale bar: 25 μm. Bottom: Autophagosomal pool quantification in WT (n = 26) and myt-1(pan8) I (n = 20) worms (N = 3) (2-tailed Student’s t test). (G and H) Top: Representative fluorescence images of mCherry:LGG-1 puncta in the posterior bulb of the pharynx (G) and in body wall muscle (H) of N2 (WT) and myt-1(pan8) I worms. Scale bars: 25 μm (G) and 50 μm (H). Bottom: Relative quantification of mCherry:LGG-1 puncta in basal condition (Fed) and after 24-hour starvation (Starved) in M9 buffer. WT Fed (n = 14), myt-1(pan8) I Fed (n = 22), WT STV 24 h (n = 17), myt-1(pan8) I STV 24 h (n = 27); N = 2 (2-tailed Student’s t test). (I) Top: Representative fluorescence images of single fibers from FDB muscle transfected with YFP-LC3/3xFlagMYTHO or YFP-LC3/Flag–empty vector in basal condition. Scale bars: 20 μm. Bottom: Quantification of LC3 puncta in more than 12 fibers (2-tailed Student’s t test). All bars indicate SEM. *P < 0.05; **P < 0.01; ***P < 0.001; ****P < 0.0001. N = number of independent experiments; n = number of cells/samples.
Figure 6
Figure 6. MYTHO interacts with autophagic proteins.
(A) Mass spectrometry analysis of immunoprecipitated endogenous HA-tagged MYTHO. Significant autophagy-related proteins are shown in the graph. (B) Quantification of WIPI2 puncta in Fed and starved (2 hours with Earle’s balanced salt solution [EBSS]) conditions in WT and Mytho-KO C2C12 cells in N = 3. Fed WT (n = 141); Fed Mytho-KO (n = 144), EBSS 2 h WT (n = 139); EBSS 2 h Mytho-KO (n = 172). Bars indicate SEM. ****P < 0.0001 (1-way ANOVA with Tukey’s multiple-comparison test). (C) HEK293 cells transfected with WIPI2-GFP or GFP were immunoprecipitated with GFP-TRAP. The quantification of N = 3 (normalized by input) is shown in Supplemental Figure 9E. (D) HEK293 cells transfected with MYTHO-GFP or GFP were immunoprecipitated. Endogenous WIPI2, ATG7, and BCAS3 were immunoblotted. In the blot on the left, lanes were run on the same gel but were noncontiguous. The quantification of N = 3 (normalized by input) is represented in Supplemental Figure 9F. N = number of independent experiments; n = number of cells/samples.
Figure 7
Figure 7. MYTHO is required for WIPI2 and BCAS3 localization on autophagosomes.
(A) Representative scheme showing predicted LC3 interaction motifs and WD40 domains: Y91A/V94A (M1); F131A/L134A (M2); Y288A/L291A (M3); W351A/I354A (M4); 208delTGPSGLRLRL (M5) or Y288A/L291A + 208delTGPSGLRLRL (M3/M5). (B and C) HEK293 cells transfected with GFP, MYTHO-GFP, or MYTHO-GFP mutants were lysed and immunoprecipitated with GFP-TRAP, and blotted with indicated markers. All samples were run on the same gel. Quantification of LC3, WIPI2, and BCAS3 enrichment (normalized to input) is shown in Supplemental Figure 10, B–D (N = 3). (D) HEK293 cells were transfected with the following vectors: empty (GFP), GFP-WIPI2 or WIPI2 mutants (GFP-RERE [R108E/R128E], GFP-FTTG, or double mutant). Immunoprecipitation was performed as in B and C, and endogenous BCAS3 or MYTHO was blotted. (E) Left: Representative fluorescence images of endogenous WIPI2 protein in Mytho-KO cells transfected with GFP or MYTHO-GFP vector. Scale bars: 20 μm. Right: Quantification of WIPI2 puncta/cell in Fed and 2-hour starved (STV) (N = 3) using ImageJ software. Fed WT + GFP (n = 34); Fed Mytho-KO + GFP (n = 69), Fed Mytho-KO + MYTHO-GFP (n = 49); HBSS 2h WT + GFP (n = 12); HBSS 2h Mytho-KO + GFP (n = 53), HBSS 2h Mytho-KO + MYTHO-GFP (n = 33) (1-way ANOVA on ranks [Kruskal-Wallis test]). (F and G) WT and Mytho-KO C2C12 cells were transfected with empty (GFP), MYTHO-GFP (WT), M1-GFP, M3-GFP, M5-GFP, or M3/M5-GFP vector. The quantification of endogenous LC3 (F) or WIPI2 (G) puncta in the fed condition was performed using ImageJ software (N = 3). For LC3 puncta: WT + GFP (n = 91); Mytho-KO + GFP (n = 101), Mytho-KO + WT (n = 84); Mytho-KO + M1 (n = 41); Mytho-KO + M3 (n = 48), Mytho-KO + M5 (n = 40), Mytho-KO + M3/M5 (n = 53) (1-way ANOVA with Tukey’s multiple-comparison test). For WIPI2 puncta: WT + GFP (n = 107); Mytho-KO + GFP (n = 119), Mytho-KO + WT (n = 98); Mytho-KO + M1 (n = 65); Mytho-KO + M3 (n = 115), Mytho-KO + M5 (n = 50), Mytho-KO + M3/M5 (n = 56) (1-way ANOVA on ranks [Kruskal-Wallis test]). All bars indicate SEM. **P < 0.001; ****P < 0.0001. N = number of independent experiments; n = number of samples.
Figure 8
Figure 8. myt-1 controls longevity through the eat-2 and glp-1 signaling pathways.
(A) Survival curves of fer-15(b26) II (n = 140), myt-1(pan8) I; fer-15(b26) II (n = 140), fer-15(b26) II; daf-2(e1370) III (n = 141), and myt-1(pan8) I; fer-15(b26) II, daf-2(e1370) III worms (n = 179) (N = 2). (B) Survival curves of fer-15(b26) II (n = 216), myt-1(pan8) I; fer-15(b26) II (n = 244), fer-15(b26) II; eat-2(ad1116) II (n = 171), and myt-1(pan8) I; fer-15(b26) II; eat-2(ad1116) II (n = 263) worms (N = 2/3). (C) Survival curves of fer-15(b26) II (n = 135), myt-1(pan8) I; fer-15(b26) II (n = 162), fer-15(b26) II; glp-1(e2141) III (n = 163), myt-1(pan8) I; fer-15(b26) II; glp-1(e2141) III (n = 162) (N = 2). Raw data of fer-15(b26) II and myt-1(pan8) I; fer-15(b26) II worms are the same in B and C (experiments were performed in parallel). Cox proportional hazards analysis was performed for the interaction of terms genotypes myt-1 and daf-2 (0.00018), eat-2 (0.00004), glp-1 (0.0007). (D and E) Life span of young adult fer-15(b26) II and myt-1(pan8) I; fer-15(b26) II worms fed with empty pL4440 vector or pL4440 expressing the atg-18 coding sequence [atg-18(RNAi)] (n = 260–340 worms/condition) (D) or bec-1 coding sequence [bec-1(RNAi)] (n = 228–290 worms/condition) (E) following the adulthood RNAi protocol (see Methods) (N = 3). Cox proportional hazards analysis was performed for the interaction of terms genotypes myt-1 and atg-18 RNAi (P < 0.0001), bec-1 RNAi (P = 0.01466). Raw data of fer-15(b26) II and myt-1(pan8) I; fer-15(b26) II worms are the same in D and E (experiments were performed in parallel). Log-rank test was used to compare longevity curves (see Supplemental Figure 6A for life span experimental details and statistics). (F) Body and head bends, reversals, and duration of stillness periods were quantified for 30 seconds in 10-day-old fer-15(b26) II animals (WT) and fer-15(b26) II; oxTi0882; syls321 (OE myt-1) worms fed with atg-18(RNAi) (n = 38 [WT]/n = 51 [OE myt-1]) or control bacteria (n = 33 [WT]/n = 76 [OE myt-1]) after a harsh touch stimulus at the tail (N = 2). *P < 0.05; ***P < 0.001; ****P < 0.0001. N = number of independent experiments; n = total worm number.
Figure 9
Figure 9. Scheme of MYTHO function in mammalian cells and C. elegans.
Left panel shows the effects of MYTHO inhibition in mammalian cells. The ablation of the Mytho gene causes autophagic impairment, mitochondrial dysfunction with increased ROS production, accumulation of β-galactosidase, upregulation of p21, and reduced cell proliferation. These features belong to the hallmarks of aging, supporting a MYTHO role in preventing cellular senescence. The right panel describes the consequences of myt-1 deletion in C. elegans. Consistently, autophagic flux, resistance to oxidative stress, life span, and health span were reduced in the absence of myt-1. The myt-1 contribution to life span was dissected by genetic interaction studies that identified myt-1’s involvement in glp-1– and eat-2–mediated longevity.

Similar articles

Cited by

References

    1. Leidal AM, et al. Autophagy and the cell biology of age-related disease. Nat Cell Biol. 2018;20(12):1338–1348. doi: 10.1038/s41556-018-0235-8. - DOI - PubMed
    1. Kenyon C, et al. A C. elegans mutant that lives twice as long as wild type. Nature. 1993;366(6454):461–464. doi: 10.1038/366461a0. - DOI - PubMed
    1. Johnson TE. Increased life-span of age-1 mutants in Caenorhabditis elegans and lower Gompertz rate of aging. Science. 1990;249(4971):908–912. doi: 10.1126/science.2392681. - DOI - PubMed
    1. Ogg S, et al. The Fork head transcription factor DAF-16 transduces insulin-like metabolic and longevity signals in C. elegans. Nature. 1997;389(6654):994–999. doi: 10.1038/40194. - DOI - PubMed
    1. Lin K, et al. daf-16: An HNF-3/forkhead family member that can function to double the life-span of Caenorhabditis elegans. Science. 1997;278(5341):1319–1322. doi: 10.1126/science.278.5341.1319. - DOI - PubMed

Substances