. 2024 Jun 13;134(15):e169893.
doi: 10.1172/JCI169893.

Neutrophil glucose flux as a therapeutic target in antiphospholipid syndrome

Affiliations

Neutrophil glucose flux as a therapeutic target in antiphospholipid syndrome

Ajay Tambralli et al. J Clin Invest. .

Abstract

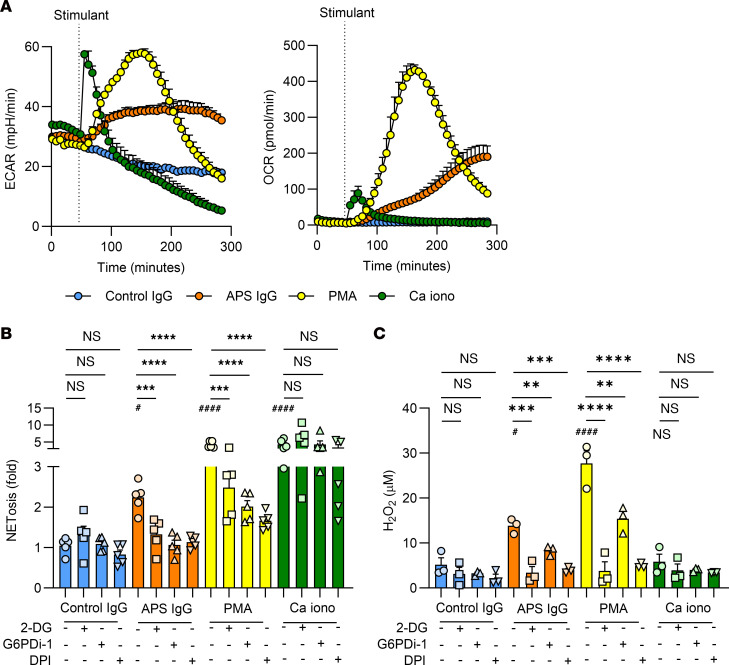
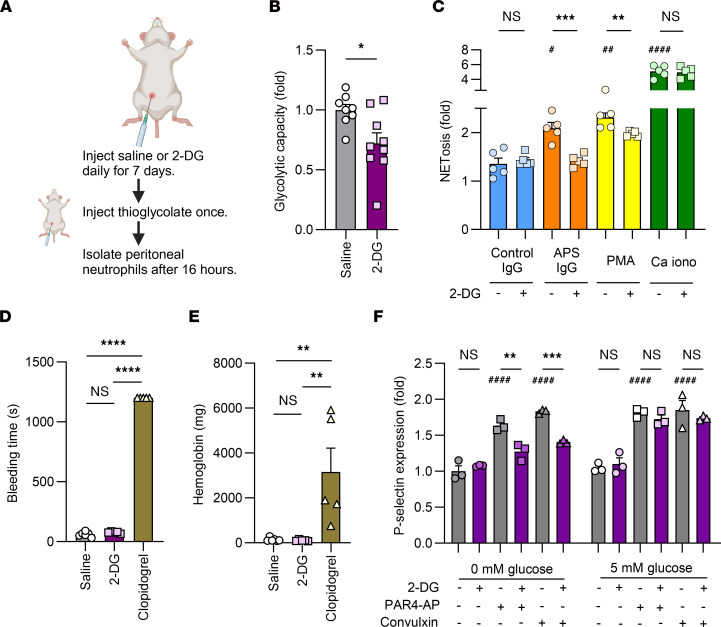
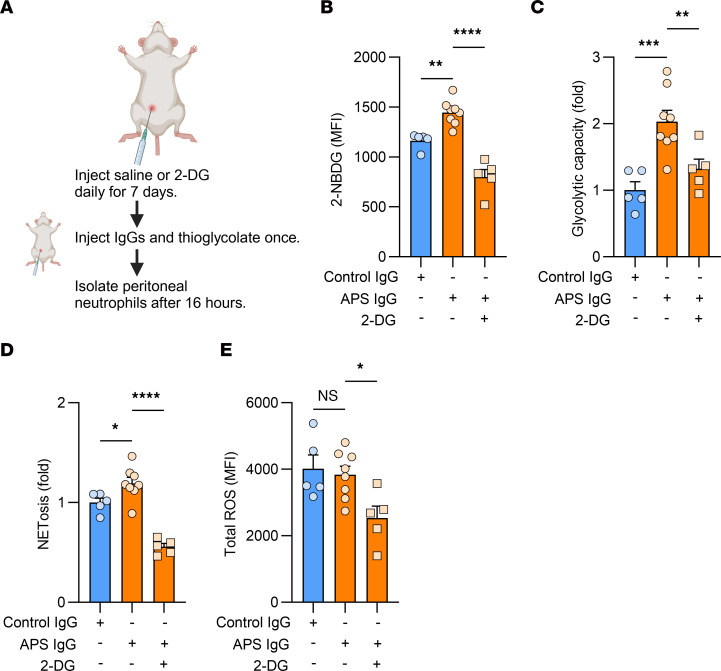
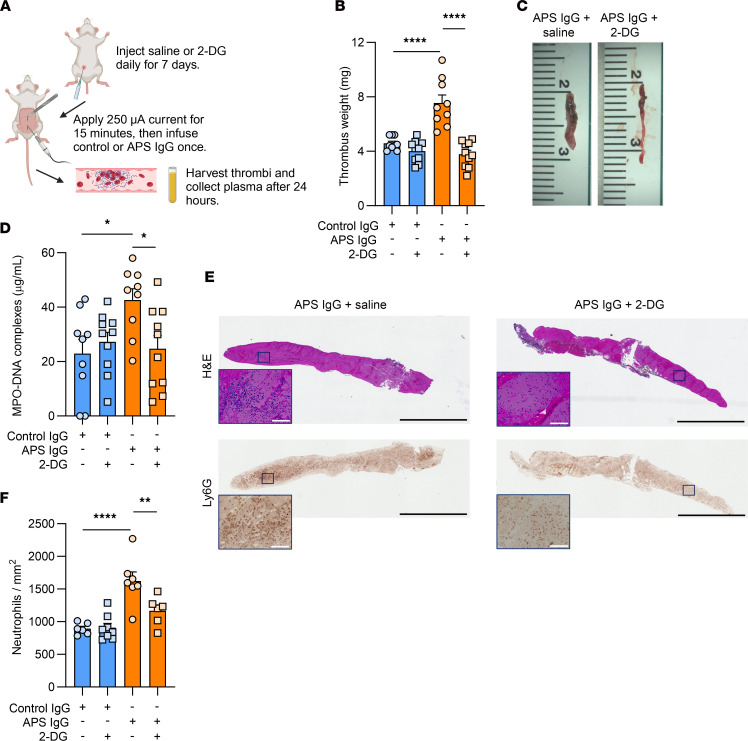
Neutrophil hyperactivity and neutrophil extracellular trap release (NETosis) appear to play important roles in the pathogenesis of the thromboinflammatory autoimmune disease known as antiphospholipid syndrome (APS). The understanding of neutrophil metabolism has advanced tremendously in the past decade, and accumulating evidence suggests that a variety of metabolic pathways guide neutrophil activities in health and disease. Our previous work characterizing the transcriptome of APS neutrophils revealed that genes related to glycolysis, glycogenolysis, and the pentose phosphate pathway (PPP) were significantly upregulated. Here, we found that neutrophils from patients with APS used glycolysis more avidly than neutrophils from people in the healthy control group, especially when the neutrophils were from patients with APS with a history of microvascular disease. In vitro, inhibiting either glycolysis or the PPP tempered phorbol myristate acetate- and APS IgG-induced NETosis, but not NETosis triggered by a calcium ionophore. In mice, inhibiting either glycolysis or the PPP reduced neutrophil reactive oxygen species production and suppressed APS IgG-induced NETosis ex vivo. When APS-associated thrombosis was evaluated in mice, inhibiting either glycolysis or the PPP markedly suppressed thrombosis and circulating NET remnants. In summary, these data identify a potential role for restraining neutrophil glucose flux in the treatment of APS.

Keywords: Autoimmune diseases; Autoimmunity; Glucose metabolism; Neutrophils.


Conflict of interest statement

Conflict of interest: CAL has received consulting fees from Astellas Pharmaceuticals, Odyssey Therapeutics, and T-Knife Therapeutics, and is an inventor on patents pertaining to Kras regulated metabolic pathways, redox control pathways in pancreatic cancer, and targeting the GOT1-pathway as a therapeutic approach (US Patent No: 2015126580-A1, 05/07/2015; US Patent No: 20190136238, 05/09/2019; International Patent No: WO2013177426-A2, 04/23/2015). JSK has received consulting fees from Jazz Pharmaceuticals, Argenx, and Roivant Sciences.

Figures

Figure 1
Figure 1. Metabolic parameters in neutrophils from people in the control group, patients with APS, patients with aPL-only, and patients with Thromb (aPL–).
(A) 2-NBDG fluorescence in people in the control group (n = 8) and patients with APS (n = 13) by flow cytometry; **P < 0.01 using t test. (B) Extracellular flux analysis of neutrophils using the glycolysis stress test. Glycolytic capacity was defined as the extracellular acidification rate measuring the maximal cellular utilization of glycolysis. Presented as fold change compared with controls; *P < 0.05, **P < 0.01 using 1-way ANOVA with Holm-Šidák’s multiple comparison test. n = 42 controls, 34 APS, 9 aPL-only, and 9 Thromb (aPL–). (C) L-Lactate in cell culture supernatant from controls (n = 11) and patients with APS (n = 17); *P < 0.05 using t test. (D) Glycolytic capacity of patients with APS with a history of microvascular disease (defined as having a history of diffuse alveolar hemorrhage, thrombotic microangiopathy, or catastrophic APS, n = 10) as compared with patients with APS without these features (n = 24); *P < 0.05 using t test. (E) Intracellular G6PD enzyme activity from controls (n = 11) and patients with APS (n = 17); *P < 0.05 using t test. (F) Total cellular ROS production in people in the control group (n = 8) and patients with APS (n = 13) as measured with DCFDA fluorescence by flow cytometry; **P < 0.01 using t test. (G) Glycogen stores in controls (n = 22) and patients with APS (n = 27); *P < 0.05 using t test.
Figure 2
Figure 2. Glycolysis and the PPP are required for APS IgG–induced human neutrophil NETosis and ROS production.
(A) Using a metabolic flux analyzer, neutrophils from controls were treated with the indicated stimuli, and ECAR (left) and OCR (right) trends were measured over 4 hours. These data are representative of 3 independent experiments. (B) Neutrophils from people in the control group (n = 5) were treated with PBS, 2-DG (10 mM), G6PDi-1 (50 μM), or DPI (10 μM) for 30 minutes and stimulated with total IgG fractions prepared from people in the control group (control IgG, 10 μg/mL), total IgG fractions prepared from patients with APS (APS IgG, 10 μg/mL), PMA (40 nM), or Ca iono (10 μM) for 3 hours and NETosis was quantified using SYTOX Green. All data are presented as fold change compared with neutrophils that were not treated with any inhibitors or stimuli. (C) Neutrophils from people in the control group (n = 3) were treated with inhibitors as in B and then stimulated as indicated for 1 hour. Cytosolic ROS production was quantified using the Amplex Red reagent. For BC, # represents the effectiveness of NETosis induction or ROS production for APS IgG, PMA, and Ca iono compared with control IgG using 1-way ANOVA with Holm-Šidák’s multiple comparison test; #P < 0.05, ####P < 0.0001 * represents the change in NETosis or ROS production with the inhibitors in each stimulant group using 1-way ANOVA with Holm-Šidák’s multiple comparison test; **P < 0.01, ***P < 0.001, ****P < 0.0001.
Figure 3
Figure 3. Glycogenolysis is necessary for APS IgG–induced human neutrophil NETosis and ROS production when glucose is absent from the culture media.
These experiments were conducted in media without any glucose. (A) Neutrophils from controls (n = 5) were treated with PBS or GPI (10 μM) for 30 minutes and stimulated with control IgG (10 μg/mL), APS IgG (10 μg/mL), PMA (40 nM), or Ca iono (10 μM) for 3 hours. NETosis was quantified using SYTOX Green. All data are presented as fold change compared with neutrophils that were not treated with any inhibitors or stimuli. (B) Neutrophils from controls (n = 3) were treated with inhibitors as in A and then stimulated as indicated for 1 hour and cytosolic ROS production was quantified using the Amplex Red reagent. For A and B, # represents the effectiveness of NETosis induction or ROS production for APS IgG, PMA, and Ca iono compared with control IgG using 1-way ANOVA with Holm-Šidák’s multiple comparison test; ##P < 0.01, ###P < 0.001, ####P < 0.0001. * represents the change in NETosis or ROS production with the inhibitors in each stimulant group using t test; *P < 0.05, **P < 0.01.
Figure 4
Figure 4. Representative immunofluorescence microscopy for stimulants and inhibitors as indicated.
Blue,DNA; green, neutrophil elastase; scale bars: 100 μm. Representative of 3 independent experiments.
Figure 5
Figure 5. In mice, 2-DG restrains neutrophil glycolysis, ROS production, and NETosis, but does not impact bleeding time.
(A) Timeline of treatment with saline or 2-DG (0.5 g/kg) and peritoneal neutrophil isolation. (B) Glycolytic capacity was measured and presented as fold change in the 2-DG–treated mice (n = 9) compared with the saline-treated mice (n = 8). *P < 0.05 using t test. (C) Neutrophils from mice administered saline or 2-DG (n = 5) were stimulated with control IgG (10 μg/mL), APS IgG (10 μg/mL), PMA (250 nM), or Ca iono (10 μM,) and NETosis was quantified using SYTOX Green. Data are presented as fold change compared with neutrophils from saline-treated mice that were left unstimulated. # represents the effectiveness of NETosis induction as compared with control IgG using 1-way ANOVA with Holm-Šidák’s multiple comparison test; #P < 0.05, ##P < 0.01, and ####P < 0.0001. * represents the change in NETosis in neutrophils from mice administered 2-DG compared with the mice administered saline in each stimulant group; **P < 0.01, ***P < 0.001 using t test. (D and E) C57BL/6J mice were treated with saline (n = 6), 2-DG (n = 5, 0.5 g/kg), or clopidogrel (n = 5, 2.5 mg/kg) daily for 7 days followed by quantification of (D) tail vein bleeding time and (E) accumulated hemoglobin. **P < 0.01, ****P < 0.0001 using 1-way ANOVA with Holm-Šidák’s multiple comparison test. (F) Washed platelets from C57BL/6J mice (n = 3 mice) were isolated and cultured in 0 or 5 mM glucose-containing buffers and then treated with PBS or 2-DG (10 mM) for 30 minutes followed by treatment with platelet agonists as indicated. Platelet P-selectin expression was quantified. # represents the change in P-selectin expression in platelets treated with PAR4-AP and convulxin compared with untreated platelets and * represents the change in P-selectin expression with 2-DG in each platelet agonist group using 1-way ANOVA with Holm-Šidák’s multiple comparison test; **P < 0.01, ***P < 0.001, ####P < 0.0001.
Figure 6
Figure 6. In mouse neutrophils, APS IgG promotes NETosis, 2-NBDG uptake, and glycolysis that can be restrained by 2-DG.
(A) Timeline of treatment with saline or 2-DG (0.5 g/kg), intraperitoneal IgG administration, and peritoneal neutrophil isolation. Each point represents 1 mouse; n = 5 for control IgG + saline, n = 8 for APS IgG + saline, and n = 5 for APS IgG + 2-DG. (B) 2-NBDG fluorescence was measured using flow cytometry. (C) Glycolytic capacity was measured using the glycolysis stress test. (D) Spontaneous NETosis was characterized using SYTOX Green. For C and D, data are presented as fold change in the APS IgG-treated mice compared with the control IgG-treated mice. (E) Total cellular ROS production was measured with DCFDA fluorescence. For all, *P < 0.05, **P < 0.01, ***P < 0.001, ****P < 0.0001 using 1-way ANOVA with Holm-Šidák’s multiple comparison test.
Figure 7
Figure 7. 2-DG mitigates APS IgG-induced thrombosis in mice.
(A) Time of treatment with saline or 2-DG (0.5 g/kg) and schematic of APS IgG-induced electrolytic injury model. (B) Thrombus weights; each point represents 1 mouse, n = 9 for each saline-treated group and n = 10 for each 2-DG-treated group. ****P < 0.0001 using 1-way ANOVA with Holm-Šidák’s multiple comparison test. (C) Representative thrombi from mice treated with APS IgG and saline (left) or APS IgG and 2-DG (right). (D) Plasma MPO-DNA complexes as a measure of circulating NETs; each point represents 1 mouse; *P < 0.05 using 1-way ANOVA with Holm-Šidák’s multiple comparison test. (E) Representative H&E- and Ly6G-stained thrombus sections from mice treated with APS IgG and saline (left) or APS IgG and 2-DG (right); full thrombus is at ×4 magnification, scale bars: 2,000 μm; inset is ×20 magnification, scale bars: 100 μm. (F) Quantification of neutrophil infiltration in Ly6G-stained thrombus sections. Each point represents a section from 1 mouse, n = 6 for control IgG + saline, n = 8 for control IgG + 2-DG, n = 7 for APS IgG + saline, and n = 6 for APS IgG + 2-DG; *P < 0.05, **P < 0.01, ****P < 0.0001 using 1-way ANOVA with Holm-Šidák’s multiple comparison test.

Similar articles

Cited by

References

    1. Miyakis S, et al. International consensus statement on an update of the classification criteria for definite antiphospholipid syndrome (APS) J Thromb Haemost. 2006;4(2):295–306. doi: 10.1111/j.1538-7836.2006.01753.x. - DOI - PubMed
    1. Barbhaiya M, et al. The 2023 ACR/EULAR Antiphospholipid Syndrome Classification Criteria. Arthritis Rheumatol. 2023;75(10):1687–1702. doi: 10.1002/art.42624. - DOI - PubMed
    1. Tektonidou MG, et al. EULAR recommendations for the management of antiphospholipid syndrome in adults. Ann Rheum Dis. 2019;78(10):1296–1304. doi: 10.1136/annrheumdis-2019-215213. - DOI - PMC - PubMed
    1. Jackson WG, et al. Recurrent thrombosis in patients with antiphospholipid antibodies and arterial thrombosis on antithrombotic therapy. Blood Adv. 2017;1(25):2320–2324. doi: 10.1182/bloodadvances.2017008185. - DOI - PMC - PubMed
    1. Sevim E, et al. Characteristics of patients with antiphospholipid antibody positivity in the APS ACTION International Clinical Database and Repository. Arthritis Care Res (Hoboken) 2022;74(2):324–335. doi: 10.1002/acr.24468. - DOI - PMC - PubMed

MeSH terms