. 2024 Jun 13;9(14):e174746.
doi: 10.1172/jci.insight.174746.

Adrenal gland macrophages regulate glucocorticoid production through Trem2 and TGF-β

Affiliations

Adrenal gland macrophages regulate glucocorticoid production through Trem2 and TGF-β

Yingzheng Xu et al. JCI Insight. .

Abstract

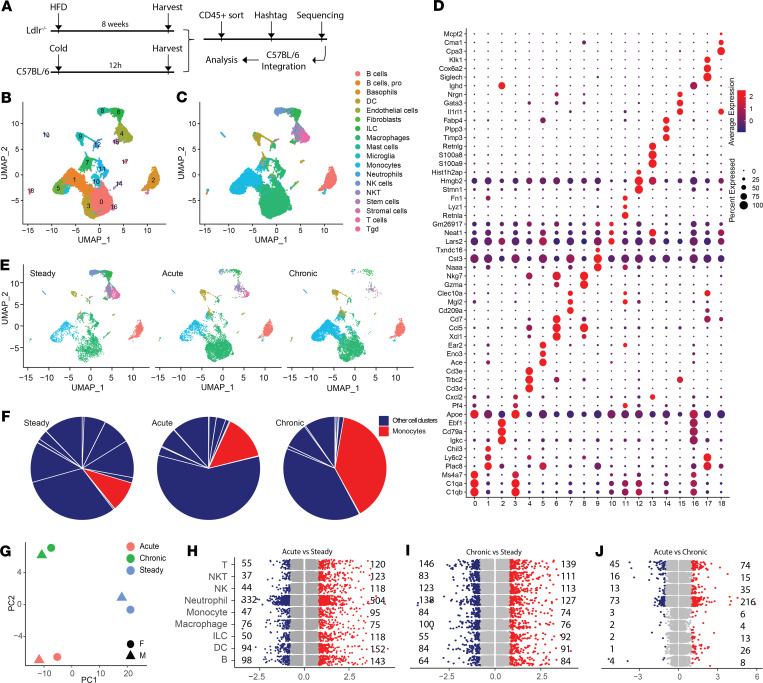
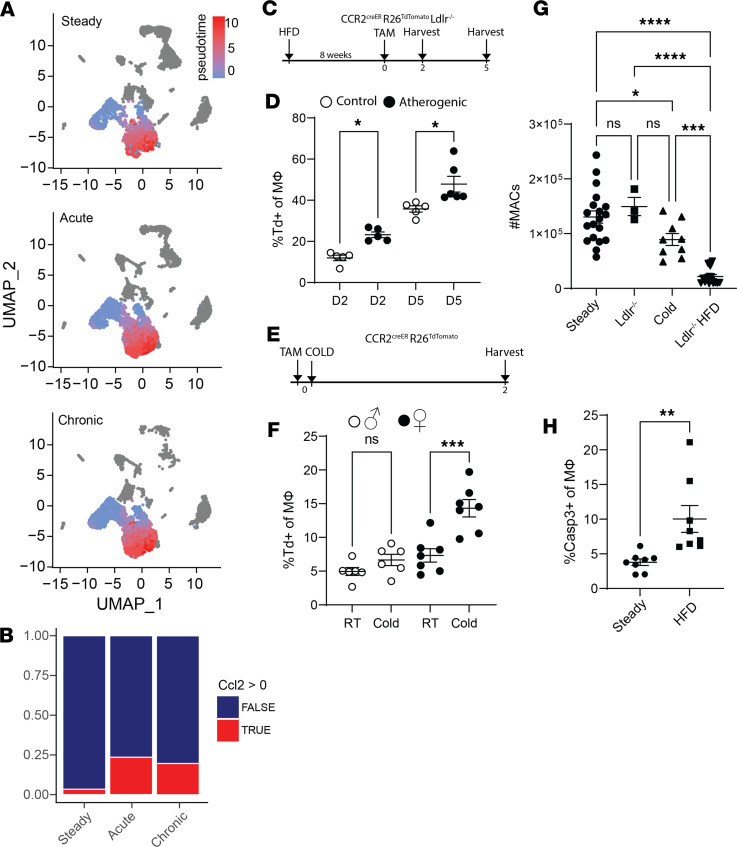
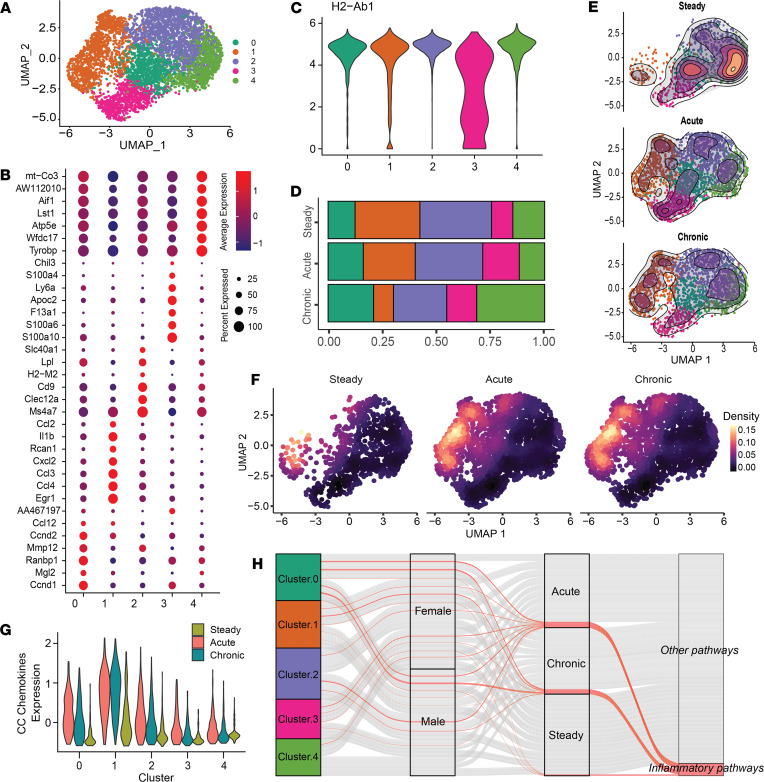
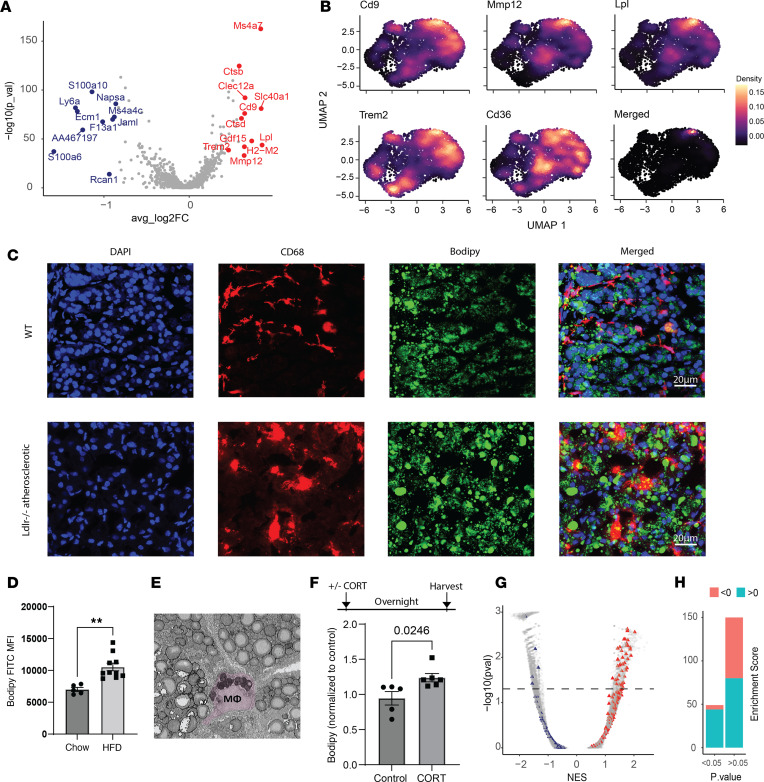
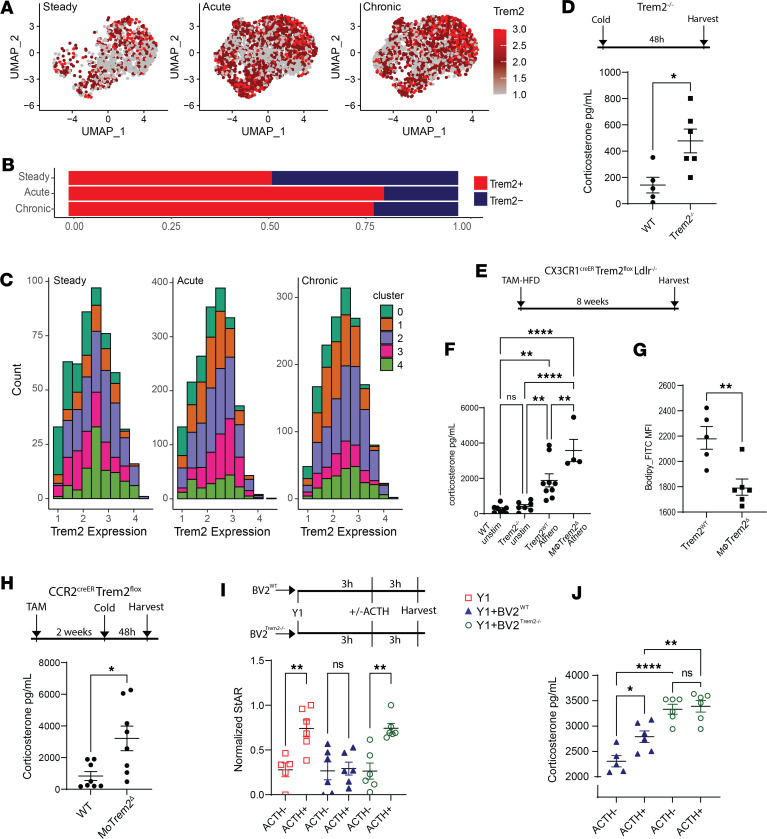
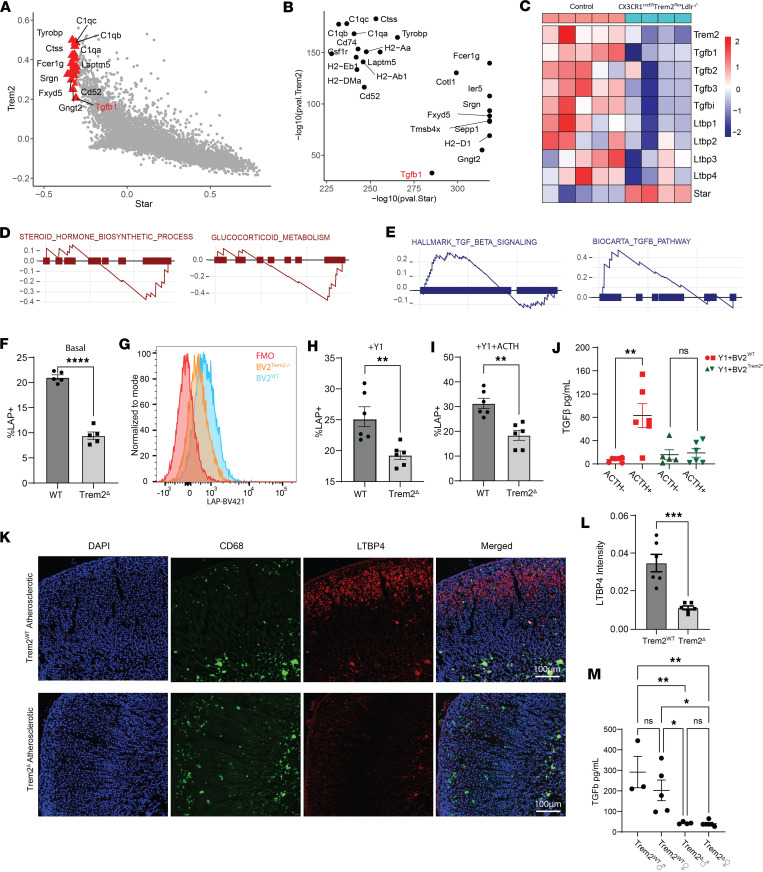
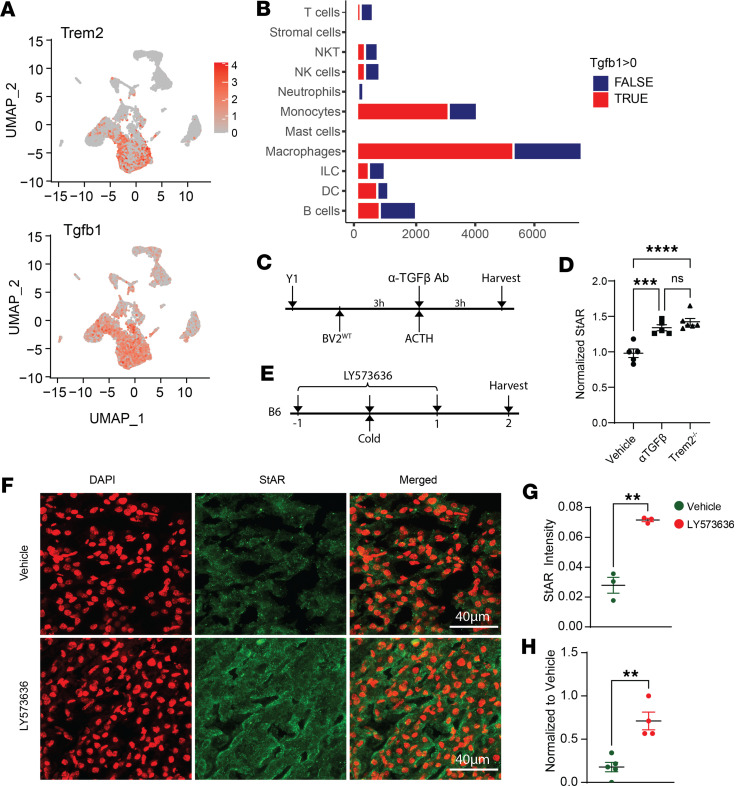
Glucocorticoid synthesis by adrenal glands (AGs) is regulated by the hypothalamic-pituitary-adrenal axis to facilitate stress responses when the host is exposed to stimuli. Recent studies implicate macrophages as potential steroidogenic regulators, but the molecular mechanisms by which AG macrophages exert such influence remain unclear. In this study, we investigated the role of AG macrophages in response to cold challenge or atherosclerotic inflammation as physiologic models of acute or chronic stress. Using single-cell RNA sequencing, we observed dynamic AG macrophage polarization toward classical activation and lipid-associated phenotypes following acute or chronic stimulation. Among transcriptional alterations induced in macrophages, triggering receptor expressed on myeloid cells 2 (Trem2) was highlighted because of its upregulation following stress. Conditional deletion of macrophage Trem2 revealed a protective role in stress responses. Mechanistically, Trem2 deletion led to increased AG macrophage death, abolished the TGF-β-producing capacity of AG macrophages, and resulted in enhanced glucocorticoid production. In addition, enhanced glucocorticoid production was replicated by blockade of TGF-β signaling. Together, these observations suggest that AG macrophages restrict steroidogenesis through Trem2 and TGF-β, which opens potential avenues for immunotherapeutic interventions to resolve stress-related disorders.

Keywords: Cytokines; Endocrinology; Immunology; Macrophages.


Conflict of interest statement

Conflict of interest: The authors have declared that no conflict of interest exists.

Figures

Figure 1
Figure 1. scRNA-Seq profiling of AG immunity.
(A) scRNA-Seq analysis of AG CD45+ sorted immune cells from acute cold–challenged C57BL/6 (B6) (male, n = 16, Hashtag 9; female: n = 15, Hashtag 10) or HFD-fed Ldlr–/– (male: n = 8 male, Hashtag 11; female: n = 13, Hashtag 12) mice. Data were integrated with previously collected control B6 AG immune cells. (B) We generated 19 clusters from all cells using resolution 0.5 shown in UMAP embedding. ILC, innate lymphoid cell; NKT, natural killer T cell; T gd, γδ T cell. (C) SingleR-predicted AG immune populations shown in UMAP embedding. (D) Dot plot showing top 3 enriched features in each of 19 clusters. Dot size and color represent percentage expressed and expression level, respectively. (E) UMAP split by treatment conditions showing cluster representation. (F) Pie chart showing the proportion of monocyte cluster (red) compared to other immune cell clusters (blue), split across treatment conditions. (G) PCA of pseudobulk-transformed scRNA-Seq data. Color indicates treatment condition. Shape represents sex. (HJ) Differentially upregulated (red) or downregulated (blue) genes comparing acute (foreground) stress against steady state (background) (H), chronic against steady state (I), and acute against chronic state (J).
Figure 2
Figure 2. Stress promotes AG macrophage turnover.
(A) Monocyte-macrophage pseudotime trajectory during stress stimulations. (B) Proportion of Ccl2+ monocytes and macrophages. (C) Schematic of fate mapping under chronic stress using control (chow-fed) or atherogenic CCR2creER R26TdTomato Ldlr–/– mice. All mice received 1 dose of TAM and were sacrificed at 2 and 5 days after TAM administration. (D) Percentage of TdTomato+ macrophages (CD11b+CD64+F4/80+) at day 2 and 5 after TAM induction. D2: day 2 after TAM, control (white, CCR2creER R26TdTomato, chow) or atherogenic (black, CCR2creER R26TdTomato Ldlr–/–, HFD) mice, n = 5 in each group. D5: day 5 after TAM, control (white, CCR2creER R26TdTomato, chow, n = 5) or atherogenic (black, CCR2creER R26TdTomato Ldlr–/–, HFD, n = 6) mice. Significance determined by Student’s t test, *P < 0.05. (E) Schematic of fate mapping under acute stress using CCR2creER R26TdTomato mice. Mice fed on chow diet received 1 dose of TAM and cold housing the same day and were housed for 2 days. (F) Percentage of TdTomato+ macrophages after 2 days of cold housing or room temperature (RT). RT (white): male mice housed at RT, n = 6. Cold (white): cold-housed male mice, n = 6. RT (black): female mice housed at RT, n = 7. Cold (black): cold-housed female mice, n = 7. Significance determined by Student’s t test, ***P < 0.001. (G) Absolute AG macrophage (CD11b+CD64+MerTK+F4/80+) number at steady state or stress setting. Steady: B6 mice, n = 22. Ldlr–/–: chow-fed Ldlr–/– mice, n = 3. Cold: B6 mice cold-housed for 2 days, n = 9. Ldlr–/– HFD: Ldlr–/– mice fed 8 weeks of HFD, n = 14. Significance determined by ANOVA, *P < 0.05, ****P < 0.0001. (H) Flow cytometry measurement of AG macrophage (CD11b+CD64+MerTK+F4/80+) caspase-3 during chronic stress. Steady: B6 mice, n = 8. HFD: Ldlr–/– mice fed 8 weeks of HFD, n = 8. Significance determined by Student’s t test, **P < 0.005. Panels D and FH are presented as mean ± SEM.
Figure 3
Figure 3. scRNA-Seq reveals AG macrophage classical activation by stress stimulation.
(A) SingleR-predicted macrophages from all cells were isolated, reclustered using resolution 0.6, and shown in UMAP embedding. (B) Dot plot showing top 7 enriched DEGs in macrophage subclusters. Color represents expression level. Dot size represents percentage of cells that express the feature. (C) Violin plot showing the H2-Ab1 expression in macrophage subclusters. (D) Proportion of macrophage subclusters in each stress condition. (E) Density plot showing cluster density in each stress condition. (F) Density plot showing integrated module score of Tnf, Il1b, and Cxcl2 in UMAP space. (G) Violin plot showing expression of integrated Ccl2, Ccl3, and Ccl4 in each macrophage subcluster, split by treatment condition. (H) GSEA pathway analysis showing TNF or LPS response–related (inflammatory) pathway among top enriched pathways. Red-colored strands represent inflammatory pathways. Grayed strands are all other pathways.
Figure 4
Figure 4. Lipid-associated AG macrophages arise after stress stimulation.
(A) Volcano plot showing DEGs generated by comparing macrophage subcluster 2 against all other macrophage populations. (B) Highlighted lipid-associated genes shown in UMAP space. (C) Lipid granules (Bodipy, green) highlighted by immunofluorescence staining. Macrophages were stained red (CD68). Nuclei were labeled by DAPI (blue). (D) Flow cytometry quantification of lipid deposition in atherosclerotic or control AG macrophages. Chow: WT mice fed on chow diet, n = 5. HFD: Ldlr–/– mice fed on 8 weeks of HFD diet, n = 10. Significance determined by Student’s t test, **P < 0.005. (E) Electron microscopy showing AG LAM from atherosclerotic Ldlr–/– mouse fed on 8 weeks of HFD. Image size, 30 µm × 27 µm. (F) Peritoneal macrophages from 2 WT mice harvested, combined, and cultured in 12-well plate with or without glucocorticoid (CORT) overnight. Data collected from 2 experiments, normalized, and merged. Control: replicates cultured in media (DMEM with 5% FBS, 1% Penicillin-Streptomycin, 1% HEPES, 1% l-glutamine), n = 5 replicates. CORT: replicates cultured in CORT-conditioned (50 ng/mL) media, n = 6 replicates. Significance determined by Student’s t test. (G) Lipid-related GSEA pathways associated with AG macrophage subcluster 2 (red) or other macrophages (blue). Colored triangles represent pathway names containing keyword “Lipid.” NES, normalized enrichment score. (H) Quantification of lipid-associated pathways in macrophage subcluster 2. Panels D and F are presented as mean ± SEM.
Figure 5
Figure 5. Macrophage Trem2 suppresses steroidogenesis.
(A) Feature plot showing Trem2 expression in macrophages across treatment groups. (B) Proportion of Trem2-expressing AG macrophages in treatment groups. (C) Histogram showing Trem2 expression distribution in macrophage subclusters. (D) Serum corticosterone in WT or Trem2–/– mice after 48 hours of cold housing. WT, n = 5. Trem2–/–, n = 6. Significance determined by Student’s t test, *P < 0.05. (E) Experimental design of atherosclerosis induction in Trem2-deficient mice fed TAM-HFD for 8 weeks. (F) Serum corticosterone in WT (n = 8), Trem2–/– (n = 7), CX3CR1creER Trem2WT Ldlr–/– (Trem2WT Athero, n = 9), or CX3CR1creER Trem2fl Ldlr–/– (MacrophageTrem2Δ Athero, n = 4) mice. Significance determined by ANOVA, **P < 0.005, ****P < 0.0001. (G) Flow cytometry quantification of AG macrophage lipid content (Bodipy). Trem2WT: atherosclerotic CX3CR1creER Trem2WT Ldlr–/– mice, n = 5. MacrophageTrem2Δ: atherosclerotic CX3CR1creER Trem2fl Ldlr–/– mice, n = 6. Significance determined by Student’s t test, **P < 0.005. (H) Serum corticosterone in CCR2creER Trem2WT mice or CCR2creER Trem2fl mice. n = 8 for each group. Significance determined by Student’s t test, *P < 0.05. (I) In vitro BV2-Y1 coculture experiment schematic. Y1 cells were assessed for StAR expression and normalized to control. n = 6 in each group, except n = 5 for Y1 ACTH. Significance determined by Student’s t test, **P < 0.005. (J) Corticosterone concentration in coculture supernatant. Blue: Y1 cocultured with WT BV2. Green: Y1 cocultured with Trem2–/– BV2. n = 6 in each group, except n = 5 for Y1 + BV2WT ACTH. Significance determined by 1-way ANOVA, *P < 0.05, **P < 0.005, ****P < 0.0001. Panels D and FJ are presented as mean ± SEM.
Figure 6
Figure 6. Trem2 modulates steroidogenesis through TGF-β.
(A) Linear correlation analysis showing Trem2- and Star-associated features in control AG macrophages; each dot represents a gene. (B) P values of highlighted genes in A. (C) Whole AG RNA-Seq: heatmap showing Trem2, TGF-β, LTBP family, and Star in control or Trem2-deficient (CX3CR1creER Trem2fl Ldlr–/–) atherosclerotic mice. Control, n = 5; Trem2-deficient, n = 4. (D) Enrichment plot showing steroid hormone biosynthesis GSEA pathways comparing WT against Trem2-deficient atherosclerotic mouse AGs. (E) Enrichment plot showing TGF-β signaling pathways comparing WT against CX3CR1creER Trem2fl Ldlr–/– atherosclerotic mice. (F) Percentage of LAP+ WT or Trem2–/– BV2 at baseline. WT BV2, n = 5;Trem2–/– BV2, n = 5 replicates. Significance determined by Student’s t test, ****P < 0.0001. (G) Histogram showing LAP MFI. FMO, fluorescence minus one. (H) Percentage of LAP+ BV2 cells, cocultured with Y1. WT BV2, n = 6 replicates. Trem2–/– BV2, n = 6 replicates. Significance determined by Student’s t test, **P < 0.005. (I) Percentage of LAP+ BV2 cells, cocultured with Y1, with ACTH. WT BV2, n = 6 replicates. Trem2–/– BV2, n = 6 replicates. Significance determined by Student’s t test, **P < 0.005. (J) Concentration of TGF-β in cell culture supernatant. WT (red), n = 6. Trem2–/– (green), ACTH+, n = 5, ACTH, n = 6. Significance determined by Student’s t test, **P < 0.005. (K) Immunofluorescence staining of LTBP4, CD68, and DAPI in CX3CR1creER Trem2WT Ldlr–/– or CX3CR1creER Trem2fl Ldlr–/– mice fed TAM-HFD for 12 weeks. (L) Quantification of LTBP4 by MFI of red pixels, n = 6 for each group. Significance determined by Student’s t test, ***P < 0.001. (M) Serum TGF-β in CX3CR1creER Trem2WT Ldlr–/– (Trem2WTn = 3, or Trem2WTn = 4) or CX3CR1creER Trem2fl Ldlr–/– (MΦTrem2Δn = 4, or MΦTrem2Δn = 6) mice after 16 weeks of TAM-HFD. Significance determined by ANOVA, *P < 0.05, **P < 0.005. Panels F, H, I, J, L, and M are presented as mean ± SEM.
Figure 7
Figure 7. TGF-β inhibition promotes steroidogenesis.
(A) Trem2 and Tgfb1 expression level shown in UMAP. (B) Quantification of Tgfb1+ immune cells. Tgfb1 positivity determined by normalized Tgfb1 expression > 0. (C) Schematic of TGF-β neutralization in in vitro Y1-WT BV2 coculture. WT BV2 and Y1 were cultured for 3 hours. αTGF-β neutralizing antibody–conditioned (0.3%) medium was reconstituted with ACTH. Cells were further cultured for 3 hours and harvested for flow cytometry. (D) Normalized (to vehicle control) percentage of StAR+ Y1 cells cultured with or without αTGF-β antibody. n = 5–6 replicates. Significance determined by ANOVA, ***P < 0.001, ****P < 0.0001. (E) Schematic of TGF-βR antagonism by LY573636 in B6 mice. Mice received 150 μL (20 mg/mL in DMSO) LY573636 1 day before cold challenge and daily during cold housing. (F) Immunofluorescence staining showing StAR expression in AG cortex. (G) Mean intensity of StAR (green pixels) in vehicle or LY573636-treated animals. Green: DMSO vehicle control, n = 3. Red: LY573636 treated, n = 3. Significance determined by Student’s t test, **P < 0.005. (H) ELISA analysis of corticosterone concentration in AG tissue. Green: DMSO vehicle control, n = 5. Red: LY573636 treated, n = 4. Data were normalized to vehicle control. Significance determined by Student’s t test, **P < 0.005.

Similar articles

Cited by

References

    1. Smith SM, Vale WW. The role of the hypothalamic-pituitary-adrenal axis in neuroendocrine responses to stress. Dialogues Clin Neurosci. 2006;8(4):383–395. doi: 10.31887/DCNS.2006.8.4/ssmith. - DOI - PMC - PubMed
    1. Sheng JA, et al. The hypothalamic-pituitary-adrenal axis: development, programming actions of hormones, and maternal-fetal interactions. Front Behav Neurosci. 2021;14:601939. doi: 10.3389/fnbeh.2020.601939. - DOI - PMC - PubMed
    1. Qi D, Rodrigues B. Glucocorticoids produce whole body insulin resistance with changes in cardiac metabolism. Am J Physiol Endocrinol Metab. 2007;292(3):E654–E667. doi: 10.1152/ajpendo.00453.2006. - DOI - PubMed
    1. Ullian ME. The role of corticosteriods in the regulation of vascular tone. Cardiovasc Res. 1999;41(1):55–64. doi: 10.1016/S0008-6363(98)00230-2. - DOI - PubMed
    1. Coutinho, et al. The anti-inflammatory and immunosuppressive effects of glucocorticoids, recent developments and mechanistic insights. Mol Cell Endocrinol. 2011;335(1):2–13. doi: 10.1016/j.mce.2010.04.005. - DOI - PMC - PubMed