. 2024 Jun 18;121(25):e2400566121.
doi: 10.1073/pnas.2400566121. Epub 2024 Jun 13.

AMBRA1 levels predict resistance to MAPK inhibitors in melanoma

Affiliations

AMBRA1 levels predict resistance to MAPK inhibitors in melanoma

Luca Di Leo et al. Proc Natl Acad Sci U S A. .

Abstract

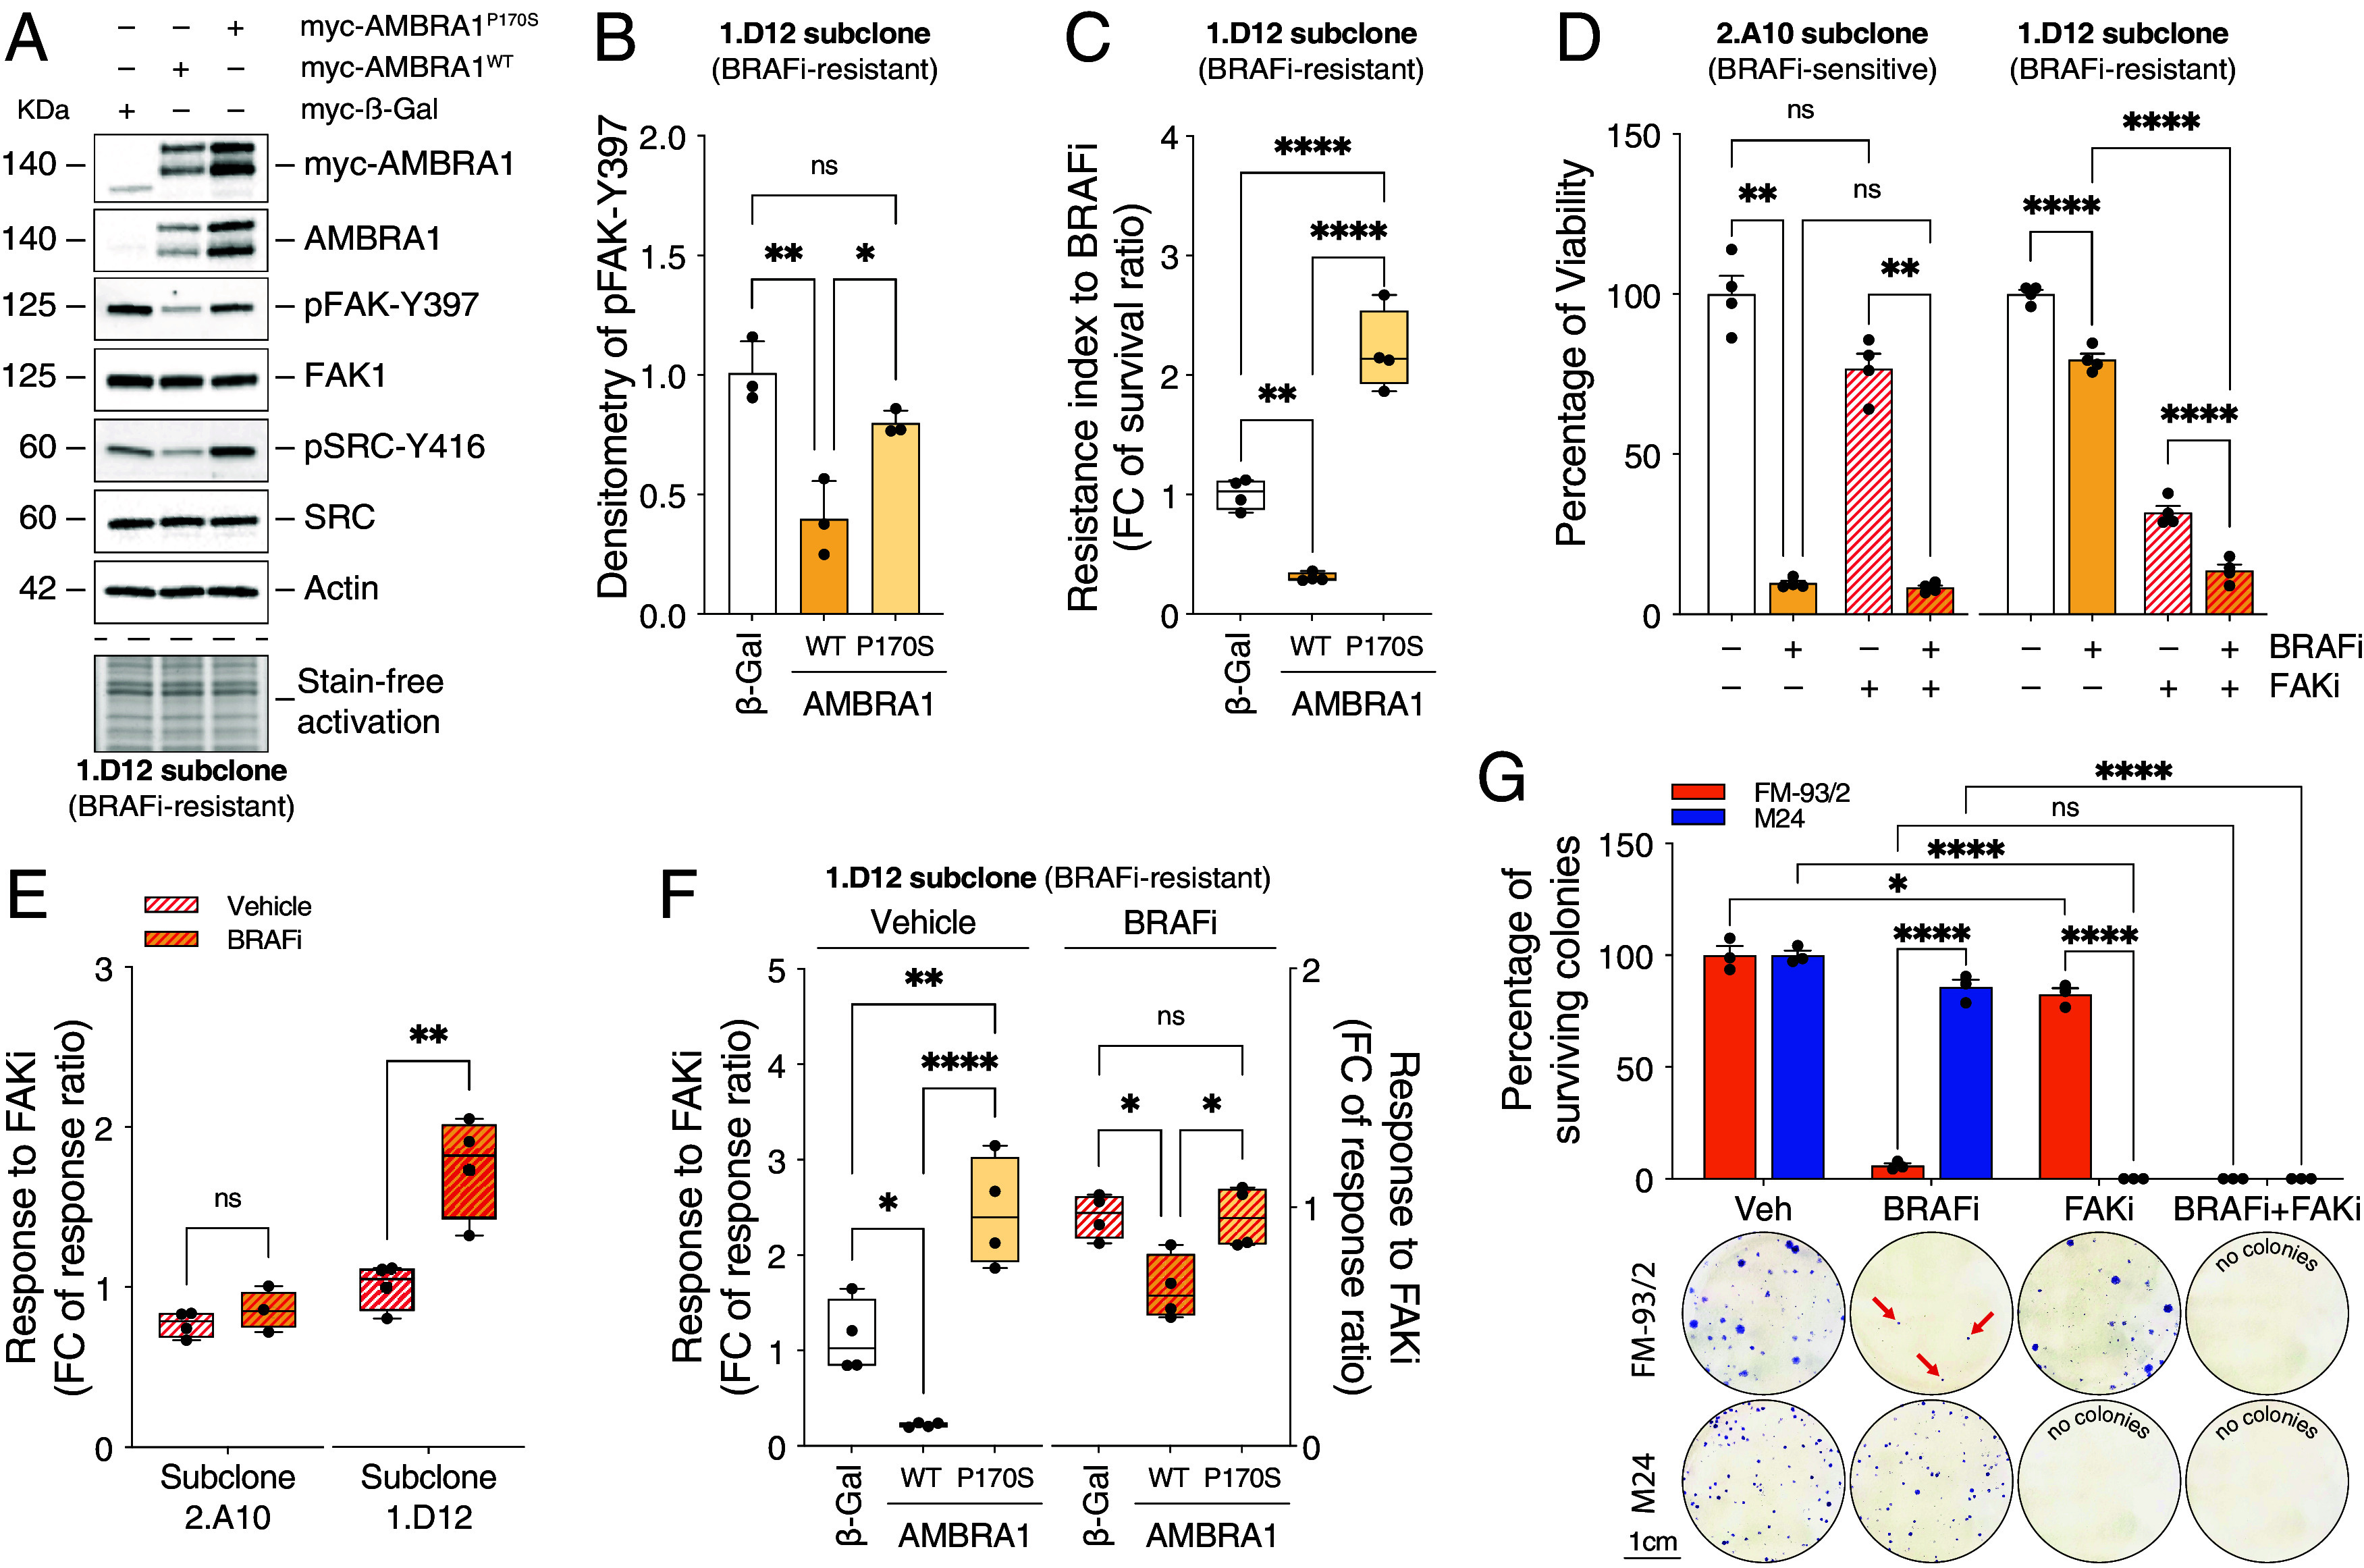
Intrinsic and acquired resistance to mitogen-activated protein kinase inhibitors (MAPKi) in melanoma remains a major therapeutic challenge. Here, we show that the clinical development of resistance to MAPKi is associated with reduced tumor expression of the melanoma suppressor Autophagy and Beclin 1 Regulator 1 (AMBRA1) and that lower expression levels of AMBRA1 predict a poor response to MAPKi treatment. Functional analyses show that loss of AMBRA1 induces phenotype switching and orchestrates an extracellular signal-regulated kinase (ERK)-independent resistance mechanism by activating focal adhesion kinase 1 (FAK1). In both in vitro and in vivo settings, melanomas with low AMBRA1 expression exhibit intrinsic resistance to MAPKi therapy but higher sensitivity to FAK1 inhibition. Finally, we show that the rapid development of resistance in initially MAPKi-sensitive melanomas can be attributed to preexisting subclones characterized by low AMBRA1 expression and that cotreatment with MAPKi and FAK1 inhibitors (FAKi) effectively prevents the development of resistance in these tumors. In summary, our findings underscore the value of AMBRA1 expression for predicting melanoma response to MAPKi and supporting the therapeutic efficacy of FAKi to overcome MAPKi-induced resistance.

Keywords: AMBRA1; FAK1; MAPK inhibitors; melanoma; targeted therapy.


Conflict of interest statement

Competing interests statement:P.L. is Chief Scientific Officer for AMLo Biosciences Ltd.

Figures

Fig. 1.
Fig. 1.
AMBRA1 downregulation upon resistance to MAPKi. (A) Waterfall plot of Log(FC) (FC = fold change) ratio of AMBRA1 expression between MAPKi-resistant and baseline (pretreatment) tumors in GSE50509 and GSE65185 cohorts (n = 72). The red line indicates cut-off. (B) AMBRA1 expression in BRAFi (vemurafenib)-treated (Post; n = 6) and pretreatment (Pre; n = 6) PDX tumors from GSE129127 (Unpaired t test; *P = 0.021). (C) Baseline tumors from GSE50509 and GSE65185 cohorts were ranked as AMBRA1HIGH (n = 18) and AMBRA1LOW (n = 21) and (D) modulation of AMBRA1 expression analyzed in matching resistant tumors. Each dot represents a sample. GSE50509: n = 8/group; 2-way ANOVA; **P = 0.0031; ****P < 0.0001. GSE65185: AMBRA1HIGH baseline n = 10; AMBRA1HIGH resistant n = 10; AMBRA1LOW baseline n = 13; AMBRA1LOW resistant n = 13; 2-way ANOVA; **P = 0.0078; ****P < 0.0001. (E) Representative western blot (n = 4) of AMBRA1 in sensitive (S) and vemurafenib-resistant (R1 to R4) cell lines from the AMBRA1HIGH FM-93/2 and AMBRA1LOW M24 cell lines. Densitometry of AMBRA1 is shown as ratio on Actin ±SD (2-way ANOVA; ****P < 0.0001). (F) BRAFV600E-mutated ESTDAB cells have been ranked as AMBRA1HIGH (n = 4) and AMBRA1LOW (n = 4), vemurafenib-resistant cells generated and (G) AMBRA1 expression analyzed and shown as in A (n = 33). The red line indicates cut-off. (H) Changes in AMBRA1 levels are shown between vemurafenib-resistant and matching sensitive cell lines for AMBRA1HIGH and AMBRA1LOW cells. Each dot represents a cell line (AMBRA1HIGH: sensitive n = 4; resistant n = 15. AMBRA1LOW: sensitive n = 4; resistant n = 18) (2-way ANOVA; ****P < 0.0001). ns = not significant.
Fig. 2.
Fig. 2.
Correlation between AMBRA1 and response to MAPKi. (A) BRAF-mutated cells from the Primary PRISM database (n = 19) were ranked for AMBRA1 expression and MAPKi response. (B) Scatter plots of the linear models fitted between 10 top MEKi and BRAFi median scores and AMBRA1 protein levels for the PRISM database cell lines. (C) Viability of AMBRA1HIGH (n = 4) and AMBRA1LOW (n = 4) cell lines after treatment with BRAFi (vemurafenib: 0.001-0.01-0.1-1-10 µM) and (D) MEKi (trametinib: 0.01-0.1-1-10-100 nM) for 96 h. Data are expressed as percentage vs. control cells ±SEM (n = 3 for each cell line). (E) Resistant index to BRAFi (vemurafenib) and MEKi (trametinib) in AMBRA1HIGH (n = 4) and AMBRA1LOW cells (n = 4) was calculated as fold change (FC) vs. the median viability values of AMBRA1HIGH cells ±SEM. Each dot represents a cell line (Unpaired t test; ****P < 0.0001; **P = 0.0017). (F) EC50 values for BRAFi (vemurafenib) and MEKi (trametinib) were derived in AMBRA1HIGH (n = 4) and AMBRA1LOW cells (n = 4) from the viability assays in (C and D). (G) Correlative analyses between AMBRA1 expression (Log2) and sensitivity to BRAFi (vemurafenib; two-tailed Pearson correlation) and (H) the MEKi (trametinib; two-tailed Pearson correlation) in AMBRA1HIGH (n = 4) and AMBRA1LOW cells (n = 4).
Fig. 3.
Fig. 3.
Modulation of AMBRA1 links to MAPKi response. (A) AMBRA1LOW M24 cells were transfected with a myc-AMBRA1 or a control (myc-β-Gal) plasmid and treated with BRAFi (vemurafenib, 250 nM for 96 h). Representative (n = 3) western blot of AMBRA1 (also detected with anti-myc antibody), pERK1/2-T202/Y204 and ERK1/2, Actin and stain-free activation as loading controls. (B) Percentage of cell viability vs. control case ±SEM (n = 4; 2-way ANOVA; *P = 0.0119; BRAFi:myc-β-Gal vs. BRAFi:myc-AMBRA1 **P = 0.0071; Vehicle:myc-AMBRA1 vs. BRAFi:myc-AMBRA1 **P = 0.0035) and (C) resistant index to vemurafenib ±SEM (n = 4; Unpaired t test; ****P < 0.0001). (D) Representative (n = 3) western blot of AMBRA1, pERK1/2-T202/Y204, ERK1/2, Vinculin and stain-free activation, (E) percentage of viability ±SEM (n = 4; 2-way ANOVA) and (F) resistant index ± SEM (n = 4; Unpaired t test) to vemurafenib in AMBRA1HIGH FM-93/2 cells silenced for AMBRA1 (siAMBRA1) vs. control (siScr) and treated with vemurafenib 250 nM for 96 h. (G) Percentage of cell viability vs. control cells ± SEM (shaded areas) (n = 4; 2-way ANOVA; ****P < 0.0001) and (H) vemurafenib resistance index ± SEM at 1 µM (n = 4; one-way ANOVA; siScr vs. siAMBRA1 #1 ***P = 0.0002; siScr vs. siAMBRA1 #2 ***P = 0.0005) in SK-Mel-5 cells silenced for AMBRA1 with two siRNAs (siAMBRA1 #1 and #2) or a control (siScr) and treated with increasing doses of vemurafenib (0.001-0.01-0.1-1-10 µM) for 72 h. (I) Percentage of viability of primary Bdmc wild-type (Bdmc+/+) or knock-out (Bdmc−/−) for Ambra1 treated with 0.001-0.01-0.1-1-10 µM BRAFi (dabrafenib) for 96 h. Data are expressed as percentage vs. untreated cells ±SEM (shaded areas) (n = 4; sigmoidal dose–response). (J) Tumor growth kinetics in Vehicle (Veh)- (n = 10) or BRAFi (dabrafenib 30 mg/kg/d)- (n = 9) treated syngeneic BPA-derived (sBPA) wild-type (sBPA+/+) and knock-out (sBPA−/−) mice. Red and black arrows respectively indicate starting day for treatment of sBPA−/− and sBPA+/+ mice. Data points represent average volume ± SD (2-way ANOVA; **P = 0.0065; ****P < 0.0001). (K) At the time of collection, representative tumor pictures and (L) weights were taken (each dot represents a mouse ± SD; ****P < 0.0001) (2-way ANOVA). ns = not significant.
Fig. 4.
Fig. 4.
AMBRA1 levels correlate with phenotype switching. (A) GSEA (NES = normalized enrichment score; FDR = false discovery rate) of the melanocytic, undifferentiated, and NCSC-like signatures from ref. in AMBRA1HIGH and AMBRA1LOW groups from the TCGA-SKCM (n = 70/group) and CCLE (n = 7/group) databases and (B) of the Undifferentiated (37) and Invasive (38) signature in the untreated (PRE) vs. resistant (PROG) tumors of the AMBRA1HIGH group of the GSE65185 cohort (n = 5 to 7/group). (C) Pearson correlation analyses between AMBRA1 expression and Log2 expression of NGFR, AXL, and MITF in the TCGA-SKCM datasets (n = 443) and (D) in the human AMBRA1HIGH (FM-93/2, M17, M88, Ma-Mel-51) and AMBRA1LOW (FM-55/M2, M24, Mel-5392, OCM-3) cell lines (after normalization on internal control L34). (E) RT-qPCR (n = 3) of NGFR, AXL, and MITF in the vemurafenib-resistant FM-93/2- and M24-derived R1-R4 cell lines vs. sensitive (S) lines. Data are expressed as fold change ±SEM (n = 3; 2-way ANOVA). The heatmap of the expression levels of AMBRA1 was derived from densitometry in Fig. 1E. (F) RT-qPCR data ±SEM of AMBRA1LOW M24 cells transfected for 48 h with a myc-AMBRA1-encoding plasmid vs. control cells (myc-β-Gal, red line) (n = 3; Unpaired t test; AMBRA1: ****P < 0.0001; NGFR: **P = 0.0054; AXL: **P = 0.002; MITF: **P = 0.0049). (G) Representative pictures and quantification of relative cell migration ±SD of YUMM1.7-derived R1 and R2 vemurafenib-resistant cells toward sensitive (S) cells (n = 3; Unpaired t test; *P = 0.0423; **P = 0.0099).
Fig. 5.
Fig. 5.
AMBRA1-related MAPKi resistance relies on FAK1 activation. (A) Representative western blot (n = 3) of AMBRA1, pFAK-Y397, and FAK1, LC3 (LC3-I and LC3-II) and of β-tubulin and stain-free activation (loading controls) in FM-93/2-derived vemurafenib-resistant cell lines (R1 to R4) vs. sensitive (S) and (B) densitometry of pFAK-Y397 after normalization on FAK1 and β-tubulin (n = 3; ±SD; Unpaired t test; R1 vs. S ****P < 0.0001, R2 vs. S **P = 0.0018, R3 vs. S **P = 0.004, R4 vs. S ***P = 0.0004). (C) Representative (n = 4) western blot of FAK1 signaling markers, ERK1/2 and phosphorylated form (T202/Y204) in SK-Mel-5 cells silenced for AMBRA1 (siAMBRA1 #1) vs. control (siScr) and treated with 10 µM vemurafenib for 72 h. Vinculin and stain-free activation: loading, AMBRA1: transfection controls. (D) pFAK-Y397 densitometry of C (n = 4; ±SD; 2-way ANOVA; Vehicle:siScr vs. Vehicle:siAMBRA1 **P = 0.001; BRAFi:siScr vs. BRAFi:siAMBRA1 **P = 0.0013). (E) Representative western blot (n = 3/group) of Ambra1, pFak-Y397, and Fak1 in BRAFi (dabrafenib)- vs. Vehicle-treated sBPA−/− and sBPA+/+ tumors, and (F) pFak-Y397 densitometry (n = 4; 2-way ANOVA; Vehicle:sBPA+/+ vs. Vehicle:sBPA−/− **P = 0.0053; Vehicle:sBPA−/− vs. BRAFi:sBPA−/− **P = 0.0077; ***P = 0.0006). (G) Schematic function of the AMBRA1P170S and FAK1AA mutants on FAK1 signaling (high pFAK-Y397 levels). (H) FM-93/2 cells silenced for endogenous AMBRA1 (siAMBRA1 #2) were transfected with myc-AMBRA1WT or P170 plasmids and treated with BRAFi (vemurafenib: 250 nM, 72 h). Western blot (n = 3) for AMBRA1: transfection, pERK1/2-T202/Y204 and ERK1/2: treatment, Vinculin and stain-free activation: loading controls. (I) Cell viability (±SEM) (n = 4; 2-way ANOVA; Vehicle:AMBRA1P170S vs. BRAFi:AMBRA1P170S *P = 0.0223; BRAFi:AMBRA1WT vs. BRAFi:AMBRA1P170S *P = 0.0207; **P = 0.0051) and (J) resistance index to vemurafenib (n = 4; Unpaired t test; **P = 0.0026) were measured. (K) FM-93/2 cells were silenced for endogenous FAK1 (siFAK1), transfected with either FAK1WT or AA plasmids and treated as in (H). Western blot (n = 3) for FAK1: transfection, pERK1/2-T202/Y204 and ERK1/2: treatment, Vinculin and stain-free activation: loading controls. (L) Both the cell viability ±SEM (n = 4; 2-way ANOVA; *P = 0.013; **P = 0.009; ***P = 0.0004) and (M) the resistance index ±SEM to vemurafenib (n = 4; Unpaired t test; **P = 0.0017) for cells transfected and treated as in K were measured. ns=not significant.
Fig. 6.
Fig. 6.
AMBRA1 expression heterogeneity and BRAFi resistance development. (A) Western blot (n = 3) of FM-93/2 and M24 cells treated with BRAFi (vemurafenib, 250 nM) and/or FAKi (defactinib, 5 µM) for 96 h; pFAK-Y397 and pERK1/2-T202/Y204: treatment, actin, and stain-free activation: loading controls. (B) Percentage of viability ±SEM (vs. control) of cells in A (n = 4; 2-way ANOVA; Veh:AMBRA1 LOW (M24) vs. BRAFi:AMBRA1 LOW (M24) *P = 0.0101; FAKi:AMBRA1 LOW (M24) vs. BRAFi+FAKi:AMBRA1 LOW (M24) *P = 0.0333; **P = 0.0020; ***P = 0.0002; ****P < 0.0001). (C) Percentage of cell viability ±SEM of Bdmc+/+ and Bdmc−/− cells treated with BRAFi (dabrafenib, 500 nM) and/or FAKi (PF-562271, 5 µM) for 96 h (n = 4/group; *P = 0.0335; Bdmc−/−:BRAFi vs. Bdmc−/−:FAKi **P = 0.0082; Bdmc−/−:BRAFi vs. Bdmc−/−:BRAFi+FAKi **P = 0.0082; Bdmc+/+:BRAFi vs. Bdmc−/−:BRAFi ***P = 0.0001; Bdmc+/+:FAKi vs. Bdmc−/−:FAKi ***P = 0.0005). (D) Response to FAKi ±SEM (vs. control) in FM-93/2-derived R1 and R2 cells treated with defactinib 5 µM for 72 h (n = 4; Unpaired t test). (E) Sensitivity to BRAFi in single-cell-derived FM-93/2 (vemurafenib; n = 91) and (F) YUMM1.7 (dabrafenib; n = 160) subclones after treatment with a 250 nM dose for 96 h. Each square represents a subclone and the enclosed values the percentage of response vs. untreated cells (n = 3). (G) Representative western blot analysis (n = 3) of AMBRA1, pFAK-Y397, FAK1, pSRC-Y416, and SRC in the top sensitive and resistant single-cell-derived FM-93/2 (n = 12) and (H) YUMM1.7 (n = 25) subclones. Densitometry of AMBRA1 is shown as ratio on Actin/Vinculin and as heatmap. The red line in the graphs denotes applied cut-off, while the red arrow the subclone with AMBRA1/Ambra1 expression below cut-off (≤0.5). Densitometry of pFAK-Y397 and pSRC-Y416 are shown as heatmap after normalization on FAK1 and SRC, respectively, and the loading control. (I and J) Values of densitometry from the heatmaps in G and H have been used for the correlative analyses between AMBRA1 and pFAK1-Y397 expression in both (I) FM-93/2- (n = 12; two-tailed Pearson correlation) and (J) YUMM1.7- (n = 25; two-tailed Pearson correlation) derived subclones. (K) Pearson r coefficient for the interrelation between Ambra1, pFak-Y397, and pSrc-Y416 and sensitivity to dabrafenib in YUMM1.7-derived subclones (n = 25). ns = not significant.
Fig. 7.
Fig. 7.
Analysis of AMBRA1LOW subclones in response to BRAFi and FAKi. (A) FM-93/2-derived 1.D12 subclone was transfected with myc-AMBRA1WT or myc-AMBRA1P170 and with the control plasmid myc-β-Gal. Western blot analyses for the FAK1 signaling markers were performed (n = 3). AMBRA1 was also detected with an anti-myc antibody. Actin and stain-free activation were used as loading controls. (B) Densitometry analysis of pFAK-Y397 in A after normalization on total FAK1 and Actin (n = 3; ±SD vs. β-Gal; one-way ANOVA; *P = 0.0226; **P = 0.0029). (C) Resistance index to BRAFi for cells in A after treatment with 250 nM vemurafenib for 72 h (n = 4; ±SD vs. β-Gal; one-way ANOVA; **P = 0.0032; ****P < 0.0001). (D) Percentage of cell viability ±SEM of FM-93/2-derived 2.A10 and 1.D12 subclones after 96 h of treatment with FAKi (defactinib, 2.5 µM) and/or BRAFi (vemurafenib, 250 nM) (n = 4; Unpaired t test; 2.A12 Vehicle:BRAFi **P = 0.001; 2.A12 BRAFi:BRAFi+FAKi **P = 0.0023; ****P < 0.0001) and (E) response to FAKi alone (Vehicle) or in combination with vemurafenib (BRAFi) (n = 4; ±SEM; Unpaired t test; **P = 0.0053). (F) Response to FAKi ±SEM (defactinib, 2.5 µM) alone (Vehicle) (n = 4; one-way ANOVA) or in combination with BRAFi (vemurafenib, 250 nM) (BRAFi) (n = 4; one-way ANOVA; Vehicle β-Gal vs. AMBRA1WT *P = 0.0291; BRAFi β-Gal vs. AMBRA1WT *P = 0.0182; BRAFi AMBRA1WT vs. AMBRA1P170S *P = 0.02; **P = 0.0034; ****P < 0.0001) in 1.D12 cells transfected with myc-AMBRA1WT or myc-AMBRA1P170 and with the control plasmid myc-β-Gal. (G) Representative pictures of colony formation assay and percentage of surviving colonies ±SD (vs. control) of FM-93/2 and M24 cells treated for 21 d with BRAFi (vemurafenib, 250 nM) and/or FAKi (defactinib, 500 nM) (n = 3; 2-way ANOVA; *P = 0.0151; ****P < 0.0001). ns = not significant.
Fig. 8.
Fig. 8.
AMBRA1 levels predict melanoma resistance to targeted therapy. Loss or reduced expression of AMBRA1 leads to increased resistance of melanoma to MAPKi treatment (BRAFi and MEKi) by means of a MAPK-independent pathway. This involves the hyperactivation (phosphorylation) of the FAK1 (Left). AMBRA1HIGH tumors show low expression of AMBRA1 after prolonged exposure to BRAFi, together with increased expression of NCSC-like genes. AMBRA1LOW tumors show features of intrinsic resistance to MAPKi, including high expression for NCSC-like genes. Targeting FAK1 with FAK inhibitors (FAKi) overcomes MAPKi resistance in AMBRA1LOW tumors and prevents the establishment of resistance in AMBRA1HIGH tumors (Right).

References

    1. Long G. V., Swetter S. M., Menzies A. M., Gershenwald J. E., Scolyer R. A., Cutaneous melanoma. Lancet 402, 485–502 (2023). - PubMed
    1. Shain A. H., Bastian B. C., From melanocytes to melanomas. Nat. Rev. Cancer 16, 345–358 (2016). - PubMed
    1. Shain A. H., et al. , Genomic and transcriptomic analysis reveals incremental disruption of key signaling pathways during melanoma evolution. Cancer Cell 34, 45–55.e4 (2018). - PMC - PubMed
    1. Ascierto P. A., et al. , Cobimetinib combined with vemurafenib in advanced BRAF(V600)-mutant melanoma (coBRIM): Updated efficacy results from a randomised, double-blind, phase 3 trial. Lancet Oncol. 17, 1248–1260 (2016). - PubMed
    1. Chapman P. B., et al. , Improved survival with vemurafenib in melanoma with BRAF V600E mutation. N. Engl. J. Med. 364, 2507–2516 (2011). - PMC - PubMed

MeSH terms

Substances

LinkOut - more resources