

Predicting the daily number of patients for allergic diseases using PM10 concentration based on spatiotemporal graph convolutional networks
- PMID: 38870112
- PMCID: PMC11175429
- DOI: 10.1371/journal.pone.0304106
Predicting the daily number of patients for allergic diseases using PM10 concentration based on spatiotemporal graph convolutional networks
Abstract
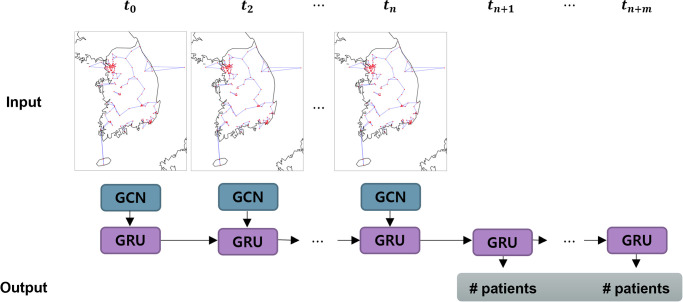
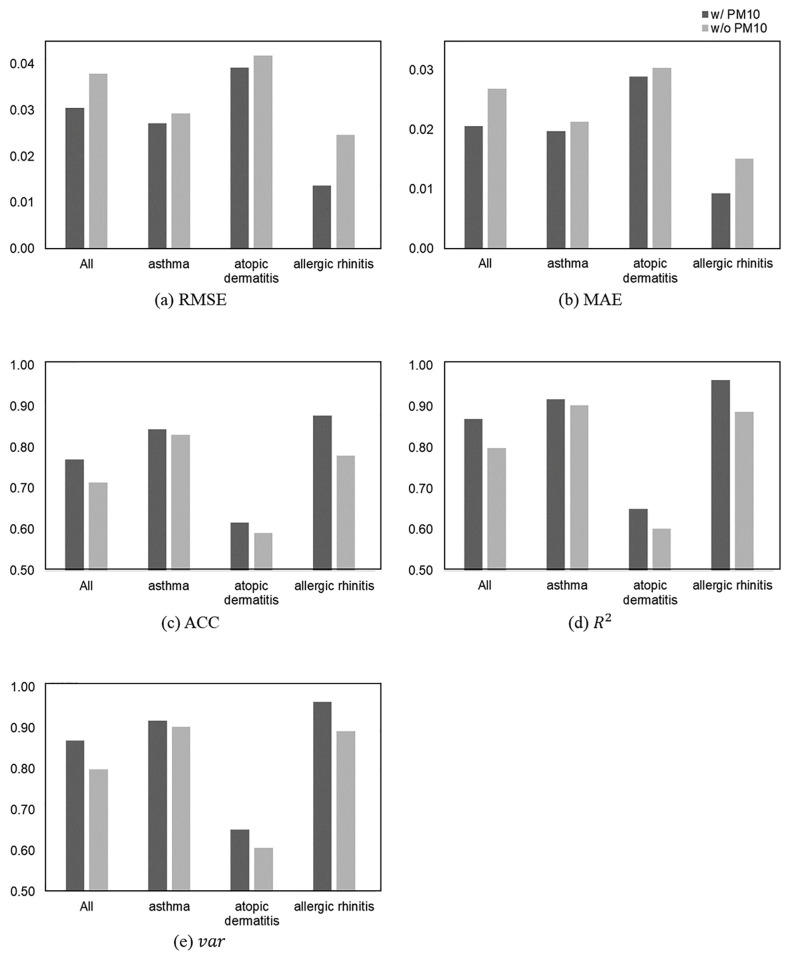
Air pollution causes and exacerbates allergic diseases including asthma, allergic rhinitis, and atopic dermatitis. Precise prediction of the number of patients afflicted with these diseases and analysis of the environmental conditions that contribute to disease outbreaks play crucial roles in the effective management of hospital services. Therefore, this study aims to predict the daily number of patients with these allergic diseases and determine the impact of particulate matter (PM10) on each disease. To analyze the spatiotemporal correlations between allergic diseases (asthma, atopic dermatitis, and allergic rhinitis) and PM10 concentrations, we propose a multi-variable spatiotemporal graph convolutional network (MST-GCN)-based disease prediction model. Data on the number of patients were collected from the National Health Insurance Service from January 2013 to December 2017, and the PM10 data were collected from Airkorea during the same period. As a result, the proposed disease prediction model showed higher performance (R2 0.87) than the other deep-learning baseline methods. The synergic effect of spatial and temporal analyses improved the prediction performance of the number of patients. The prediction accuracies for allergic rhinitis, asthma, and atopic dermatitis achieved R2 scores of 0.96, 0.92, and 0.86, respectively. In the ablation study of environmental factors, PM10 improved the prediction accuracy by 10.13%, based on the R2 score.
Copyright: © 2024 Jeon et al. This is an open access article distributed under the terms of the Creative Commons Attribution License, which permits unrestricted use, distribution, and reproduction in any medium, provided the original author and source are credited.
Conflict of interest statement
The authors have declared that no competing interests exist.
Figures
References
-
- Asher MI, Montefort S, Björkstén B, Lai CKW, Strachan DP, Weiland SK, et al.. Worldwide time trends in the prevalence of symptoms of asthma, allergic rhinoconjunctivitis, and eczema in childhood: ISAAC Phases One and Three repeat multicountry cross-sectional surveys. Lancet (London, England). 2006;368:733–743. doi: 10.1016/S0140-6736(06)69283-0 - DOI - PubMed
-
- MacIntyre EA, Gehring U, Mölter A, Fuertes E, Klümper C, Krämer U, et al.. Air pollution and respiratory infections during early childhood: an analysis of 10 European birth cohorts within the ESCAPE Project. Environmental health perspectives. 2014;122:107–113. doi: 10.1289/ehp.1306755 - DOI - PMC - PubMed
-
- Mortality GBD, of Death Collaborators C. Global, regional, and national life expectancy, all-cause mortality, and cause-specific mortality for 249 causes of death, 1980-2015: a systematic analysis for the Global Burden of Disease Study 2015. Lancet (London, England). 2016;388:1459–1544. doi: 10.1016/S0140-6736(16)31012-1 - DOI - PMC - PubMed
MeSH terms
Substances
LinkOut - more resources
Full Text Sources
Medical
Research Materials
