

Mentoring practices that predict doctoral student outcomes in a biological sciences cohort
- PMID: 38870154
- PMCID: PMC11175430
- DOI: 10.1371/journal.pone.0305367
Mentoring practices that predict doctoral student outcomes in a biological sciences cohort
Abstract
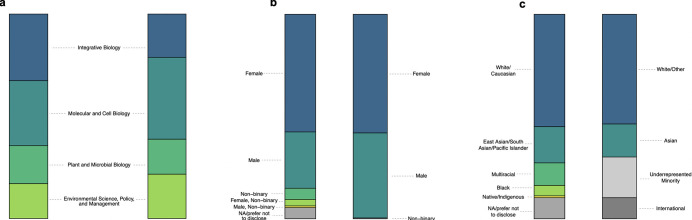
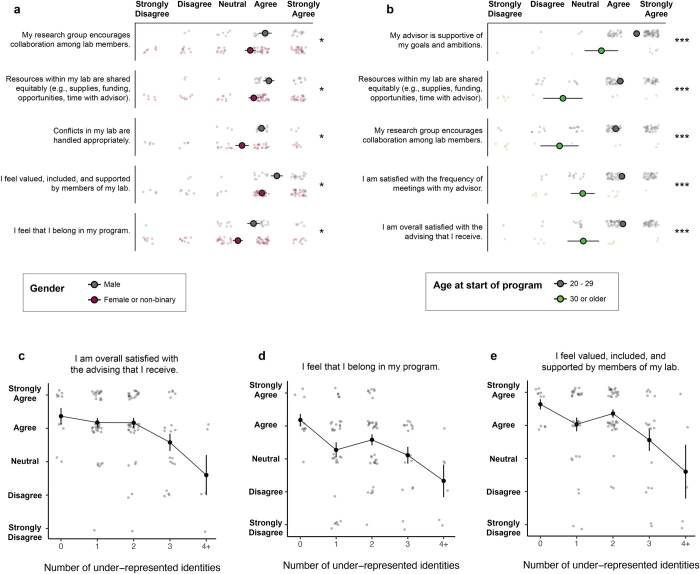
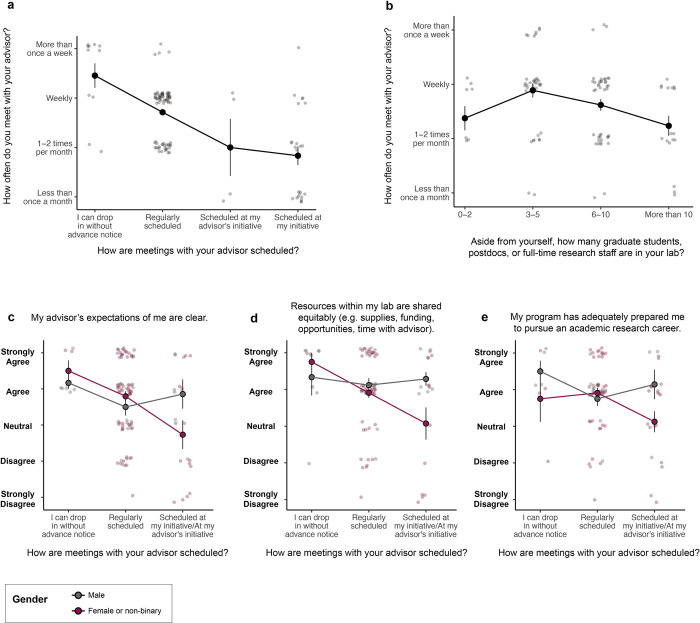
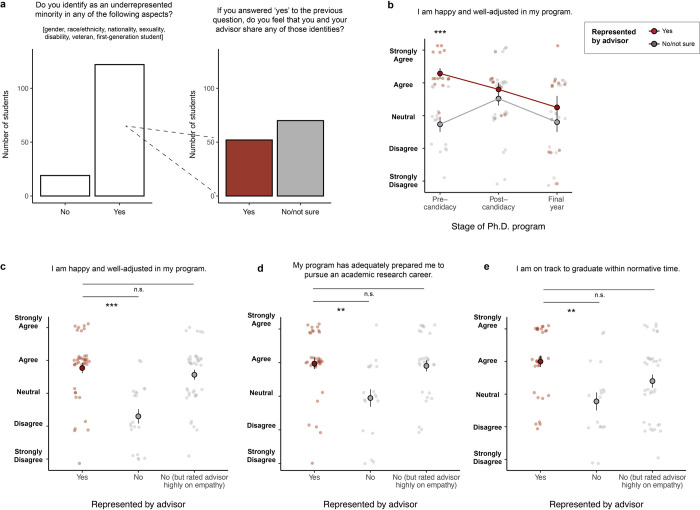
Despite the importance of a diversity of backgrounds and perspectives in biological research, women, racial and ethnic minorities, and students from non-traditional academic backgrounds remain underrepresented in the composition of university faculty. Through a study on doctoral students at a research-intensive university, we pinpoint advising from faculty as a critical component of graduate student experiences and productivity. Graduate students from minority backgrounds reported lower levels of support from their advisors and research groups. However, working with an advisor from a similar demographic background substantially improved productivity and well-being of these students. Several other aspects of mentoring practices positively predicted student success and belonging, including frequent one-on-one meetings, empathetic and constructive feedback, and relationships with other peer or faculty mentors. Our study highlights the need to renovate graduate education with a focus on retention-not just recruitment-to best prepare students for success in scientific careers.
Copyright: © 2024 Debray et al. This is an open access article distributed under the terms of the Creative Commons Attribution License, which permits unrestricted use, distribution, and reproduction in any medium, provided the original author and source are credited.
Conflict of interest statement
The authors have declared that no competing interests exist.
Figures
Similar articles
-
Race and Gender Differences in Undergraduate Research Mentoring Structures and Research Outcomes.CBE Life Sci Educ. 2017 Summer;16(2):ar34. doi: 10.1187/cbe.16-07-0211. CBE Life Sci Educ. 2017. PMID: 28550078 Free PMC article.
-
Sense of belonging within the graduate community of a research-focused STEM department: Quantitative assessment using a visual narrative and item response theory.PLoS One. 2020 May 21;15(5):e0233431. doi: 10.1371/journal.pone.0233431. eCollection 2020. PLoS One. 2020. PMID: 32437417 Free PMC article.
-
Volunteered or Voluntold? The Motivations and Perceived Outcomes of Graduate and Postdoctoral Mentors of Undergraduate Researchers.CBE Life Sci Educ. 2019 Jun;18(2):ar13. doi: 10.1187/cbe.18-10-0219. CBE Life Sci Educ. 2019. PMID: 31008673 Free PMC article.
-
Perspective: Shaping future professionals-The role of mentoring in graduate education and career development.J Dairy Sci. 2025 Apr;108(4):3014-3018. doi: 10.3168/jds.2024-26178. Epub 2025 Mar 3. J Dairy Sci. 2025. PMID: 40043767 Review.
-
Mentoring for women and underrepresented minority faculty and students: experience at two institutions of higher education.J Natl Med Assoc. 2006 Sep;98(9):1449-59. J Natl Med Assoc. 2006. PMID: 17019912 Free PMC article. Review.
References
-
- Kang K. National Science Foundation. 2021. Survey of Earned Doctorates. Available from: https://ncses.nsf.gov/pubs/nsf23300/data-tables
-
- Avolio B, Chávez J, Vílchez-Román C. Factors that contribute to the underrepresentation of women in science careers worldwide: a literature review. Soc Psychol Educ. 2020. Jul 1;23(3):773–94.
-
- Frank LL, Hackman JR. Effects of interviewer-interviewee similarity on interviewer objectivity in college admissions interviews. J Appl Psychol. 1975;60(3):356–60.
-
- Kato T, Song Y. An advisor like me: Does gender matter? SSRN Electron J. 2018; IZA Discussion Paper No. 11575.
MeSH terms
LinkOut - more resources
Full Text Sources
