. 2024 Jun 13;19(6):e0305082.
doi: 10.1371/journal.pone.0305082. eCollection 2024.

Analysis of the alpha activity envelope in electroencephalography in relation to the ratio of excitatory to inhibitory neural activity

Affiliations

Analysis of the alpha activity envelope in electroencephalography in relation to the ratio of excitatory to inhibitory neural activity

Misako Sano et al. PLoS One. .

Abstract

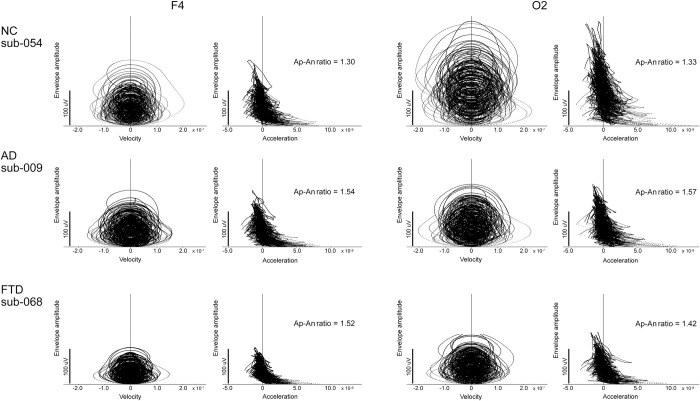
Alpha waves, one of the major components of resting and awake cortical activity in human electroencephalography (EEG), are known to show waxing and waning, but this phenomenon has rarely been analyzed. In the present study, we analyzed this phenomenon from the viewpoint of excitation and inhibition. The alpha wave envelope was subjected to secondary differentiation. This gave the positive (acceleration positive, Ap) and negative (acceleration negative, An) values of acceleration and their ratio (Ap-An ratio) at each sampling point of the envelope signals for 60 seconds. This analysis was performed on 36 participants with Alzheimer's disease (AD), 23 with frontotemporal dementia (FTD) and 29 age-matched healthy participants (NC) whose data were provided as open datasets. The mean values of the Ap-An ratio for 60 seconds at each EEG electrode were compared between the NC and AD/FTD groups. The AD (1.41 ±0.01 (SD)) and FTD (1.40 ±0.02) groups showed a larger Ap-An ratio than the NC group (1.38 ±0.02, p<0.05). A significant correlation between the envelope amplitude of alpha activity and the Ap-An ratio was observed at most electrodes in the NC group (Pearson's correlation coefficient, r = -0.92 ±0.15, mean for all electrodes), whereas the correlation was disrupted in AD (-0.09 ±0.21, p<0.05) and disrupted in the frontal region in the FTD group. The present method analyzed the envelope of alpha waves from a new perspective, that of excitation and inhibition, and it could detect properties of the EEG, Ap-An ratio, that have not been revealed by existing methods. The present study proposed a new method to analyze the alpha activity envelope in electroencephalography, which could be related to excitatory and inhibitory neural activity.


Conflict of interest statement

The authors have declared that no competing interests exist.

Figures

Fig 1
Fig 1. Illustration of the concept of the present study.
Left: Alpha wave oscillation in a cortical area forms a balance between excitation and inhibition via neural circuits with subcortical structures such as the thalamus and other cortices and networks at rest. P: cortical pyramidal cells. Top right: The waxing and waning of alpha oscillations occurs in a balance in relation to the excitation and inhibition balance of the cortical region and is transmitted as neural information. In dementia, this balance is abnormal and functional impairment occurs. Arrows indicate positive (Ap) and negative (An) accelerations, second-order derivatives in time, of the alpha envelope. Bottom right: Mathematical implication. Neural oscillator models, such as neural mass models, contain non-linear equations of oscillation. The second-order derivatives in the equations can be inhibitory or excitatory forces, the balance of which is an important element of neural function. The small black and gray balance diagram in the figure shows a balanced and imbalanced condition, respectively. We calculated the ratio of positive and negative acceleration values, Ap-An ratio, during an analysis period in the present study. We assumed that the ratio was an indicator of the balance between excitation and inhibition in the cortical region. Note: The equations are simple oscillator model equations for illustrative purposes, not equations describing the envelope of the alpha oscillation.
Fig 2
Fig 2. Representation of the electroencephalography (EEG) signal analysis method.
The figures were created using 5-second EEG signals obtained at the F4 electrode in sub-037 (221–226 sec). A: EEG signals filtered by alpha band frequency (8–12 c/s). B: EEG signals rectified (thin line) and peak envelope (solid line). C: First derivative of the envelope. D: Second-order derivative of the envelope. E: An Ap-An ratio was an absolute value of the ratio of mean positive derivatives to mean negative derivatives for 60 seconds.
Fig 3
Fig 3. Relationship between envelope amplitude and first and second-order derivatives at electrodes F4 and O2 at each sampling point in 60 seconds.
One participant was presented in each group. Each vertical axis represents the envelope amplitude and the horizontal axis represents the first (Velocity) and the second-order (Acceleration) derivatives in time of the envelope (see Fig 2D) at each sampling point. While the first derivative values were symmetrically distributed with positive and negative values for each envelope amplitude, the second-order derivative values showed an asymmetrical distribution depending on the value of the envelope amplitude. In other words, the positive second-order derivative values were larger for smaller envelope amplitudes, while the negative second-order derivative values had a similar distribution for all amplitudes. The Ap-An ratios of the NC participant were lower than those of the AD and FTD participants, regardless of the envelope amplitude. NC: normal control; AD: participants with Alzheimer’s disease; FTD: participants with frontotemporal dementia.
Fig 4
Fig 4. The mean envelope amplitude and mean Ap-An ratio at each electrode in the groups.
The graphs are arranged from left to right, starting with the electrode with the highest value in the NC group. The Ap-An ratio was correlated with the envelope amplitude as shown in Table 3, but the order of the Ap-An ratio did not necessarily coincide with the order of the envelope amplitude. Black columns/circles (NC): normal control; white columns/circles (AD): participants with Alzheimer’s disease; and light gray columns/circles (FTD): participants with frontotemporal dementia. A vertical bar indicates a standard deviation for each envelope amplitude. The Ap-An ratio was strongly negatively correlated with envelope amplitude across 19 electrodes in the NC (r = -0.921, *p < 0.000001) and FTD (-0.771, *0.00011) groups, but not in the AD group (r = -0.306).
Fig 5
Fig 5. Correlation between alpha envelope amplitude and Ap-An ratio at electrode (10 electrodes were shown).
NC (black circles): normal control; AD (white circles): participants with Alzheimer’s disease; FTD (gray circles): participants with frontotemporal dementia. Correlation curves were shown for each electrode. Significant correlation coefficient: *p < 0.05, corrected by FDR.
Fig 6
Fig 6. Correlation between envelope amplitude (Amplitude) and the Ap-An ratio.
All values in each group were plotted as black dots, and correlation curves for 19 electrodes were shown. NC: normal control; AD: participants with Alzheimer’s disease; FTD: participants with frontotemporal dementia.

Similar articles

Cited by

References

    1. Adrian ED, Matthews BHC. The Berger rhythm: Potential changes from the occipital lobes in man. Brain. 1934;57(4):355–385. 10.1093/brain/57.4.355 - DOI - PubMed
    1. Quigley C. Forgotten rhythms? Revisiting the first evidence for rhythms in cognition. Eur J Neurosci. 2022;55(11–12):3266–76. doi: 10.1111/ejn.15450 - DOI - PMC - PubMed
    1. Lopes da Silva F. Neural mechanisms underlying brain waves: from neural membranes to networks. Electroencephalogr Clin Neurophysiol.1991;79(2):81–93. doi: 10.1016/0013-4694(91)90044-5 - DOI - PubMed
    1. Silva LR, Amitai Y, Connors BW. Intrinsic oscillations of neocortex generated by layer 5 pyramidal neurons. Science. 1991;251(4992):432–5. doi: 10.1126/science.1824881 - DOI - PubMed
    1. Salek-Haddadi A, Friston KJ, Lemieux L, Fish DR. Studying spontaneous EEG activity with fMRI. Brain Res Brain Res Rev. 2003;43(1):110–33. doi: 10.1016/s0165-0173(03)00193-0 - DOI - PubMed