

Reduced expression of E-cadherin correlates with poor prognosis and unfavorable clinicopathological features in gastric carcinoma: a meta-analysis
- PMID: 38870263
- PMCID: PMC11236327
- DOI: 10.18632/aging.205929
Reduced expression of E-cadherin correlates with poor prognosis and unfavorable clinicopathological features in gastric carcinoma: a meta-analysis
Abstract
Backgrounds: Gastric carcinoma (GC) is one of the most fatal human malignancies globally, with a median survival time less than 1 year. E-cadherin exerts a crucial role in the development and progression of GC as an adhesive, invasive suppressor gene. Whether reduced E-cadherin has an impact on prognosis, clinicopathological features for GC has been well studied, but no conclusive results has been obtained.
Methods: Eligible studies and relevant data were obtained from PubMed, Elsevier, Embase, Cochrane Library and Web of Science databases until June 30, 2023. A fixed- or random-effects model was used to calculate pooled odds ratios (OR) and 95% confidence intervals (CI). Correlation of E-cadherin expression with overall survival (OS), clinicopathological features and risk factors were evaluated.
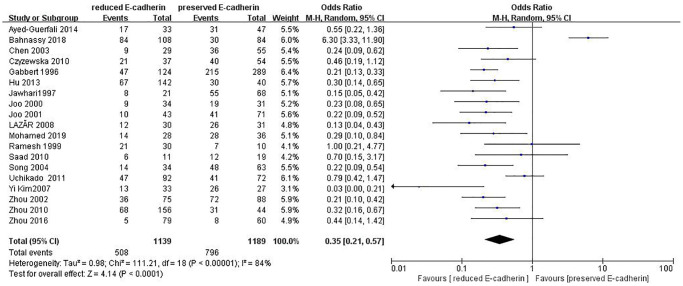
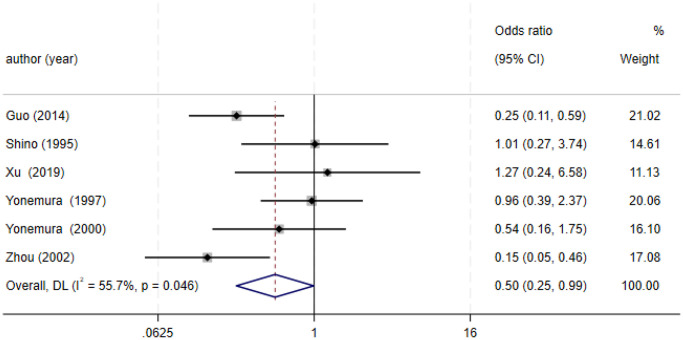
Results: 36 studies fulfilled the selected criteria. 9048 cases were included. This meta-analysis showed that patients with GC with reduced E-cadherin had unfavourable clinicopathological features and poor OS. The pooled ORs of one-, three- and five-year OS were 0.38 (n = 25 studies, 95%CI: 0.25-0.57, Z = 4.61, P < 0.00001), 0.33 (n = 25 studies, 95% CI: 0.23-0.47, Z = 6.22, P < 0.00001), 0.27 (n = 22 studies, 95% CI: 0.18-0.41, Z = 6.23, P < 0.00001), respectively. Moreover, reduced E-cadherin expression significantly correlated with differentiation grade (OR = 0.29, 95% CI: 0.22-0.39, Z = 8.58, P < 0.00001), depth of invasion (OR = 0.49, 95% CI: 0.36-0.66, Z = 4.58, P < 0.00001), lymphatic node metastasis (OR = 0.49, 95% CI: 0.38-0.64, Z = 5.38, P < 0.00001), distant metastasis (OR = 2.24, 95% CI: 1.62-3.09, Z = 4.88, P < 0.00001), peritoneal metastasis (OR = 2.17, 95% CI: 1.39-3.39, Z = 3.40, P = 0.0007), TNM stage (OR = 0.41, 95% CI: 0.28-0.61, Z = 4.44, P < 0.00001), lymphatic vessel invasion (OR = 1.77, 95% CI: 1.11-2.82, Z = 2.39, P = 0.02), vascular invasion (OR = 1.55, 95% CI: 1.22-1.96, Z = 3.58, P = 0.0003), Lauren type (OR = 0.35, 95% CI: 0.21-0.57, Z = 4.14, P < 0.0001), Borrmann classification (OR = 0.50, 95% CI: 0.25-0.99, Z = 1.97, P = 0.048) and tumor size (≥5 cm vs. <5 cm: OR = 1.73, 95% CI: 1.34-2.23, Z = 4.19, P < 0.0001; ≥6 cm vs. <6 cm: OR = 2.29, 95% CI: 1.51-3.49, Z = 3.87, P = 0.0001). No significant association was observed between reduced E-cadherin expression and liver metastasis, perineural invasion, alcohol consumption, smoking status, familial history, Helicobacter pylori (HP) infection.
Conclusions: The reduced expression of E-cadherin is significantly correlated with poor OS and unfavourable clinicopathological features in GC. The expression level of E-cadherin not only serves as a predictor for disease progression and prognosis in GC but also emerges as a novel therapeutic target.
Keywords: E-cadherin; clinicopathological feature; gastric carcinoma; prognosis; risk factors.
Conflict of interest statement
Figures


References
-
- Becker KF, Atkinson MJ, Reich U, Becker I, Nekarda H, Siewert JR, Höfler H. E-cadherin gene mutations provide clues to diffuse type gastric carcinomas. Cancer Res. 1994; 54:3845–52. - PubMed
Publication types
MeSH terms
Substances
LinkOut - more resources
Full Text Sources
Medical
Research Materials
Miscellaneous
