

Characterization of tumor endothelial cells (TEC) in gastric cancer and development of a TEC-based risk signature using single-cell RNA-seq and bulk RNA-seq data
- PMID: 38870270
- PMCID: PMC11236301
- DOI: 10.18632/aging.205928
Characterization of tumor endothelial cells (TEC) in gastric cancer and development of a TEC-based risk signature using single-cell RNA-seq and bulk RNA-seq data
Abstract
Background: Tumor endothelial cells (TECs) are essential participants in tumorigenesis. This study is focused on elucidating the TEC traits in gastric cancer (GC) and constructing a prognostic risk model to predict the clinical outcome of GC patients.
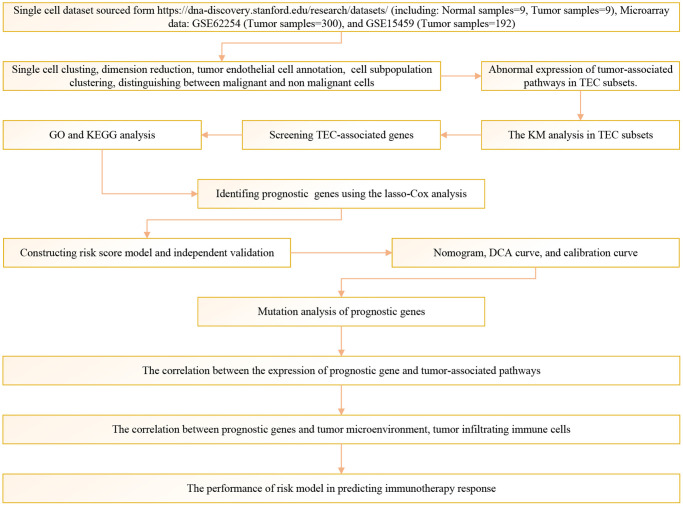
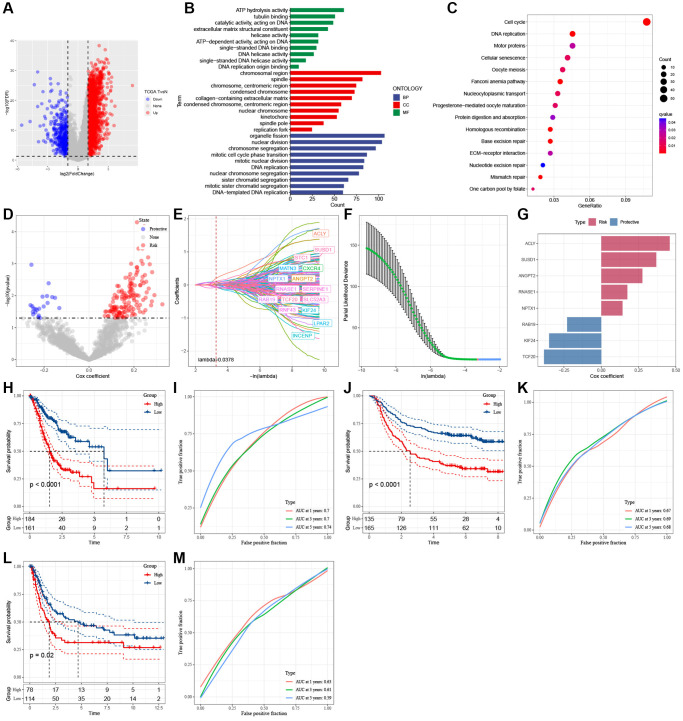
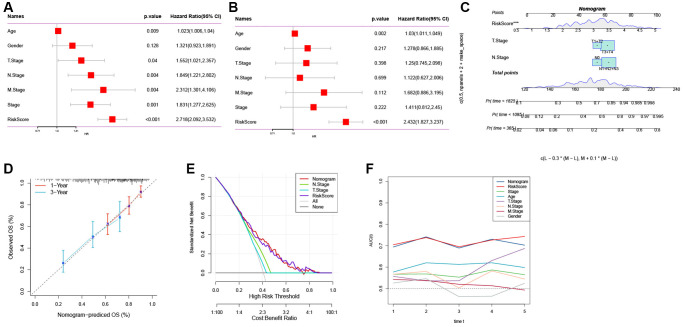
Methods: Single-cell RNA sequencing (scRNA-seq) data were obtained from the GEO database. Using specific markers, the Seurat R package aided in processing scRNA-seq data and identifying TEC clusters. Based on TEC cluster-associated genes identified by Pearson correlation analysis, TEC-related prognostic genes were screened by lasso-Cox regression analysis, thereby constructing a risk signature. A nomogram was created by combining the risk signature with clinicopathological features.
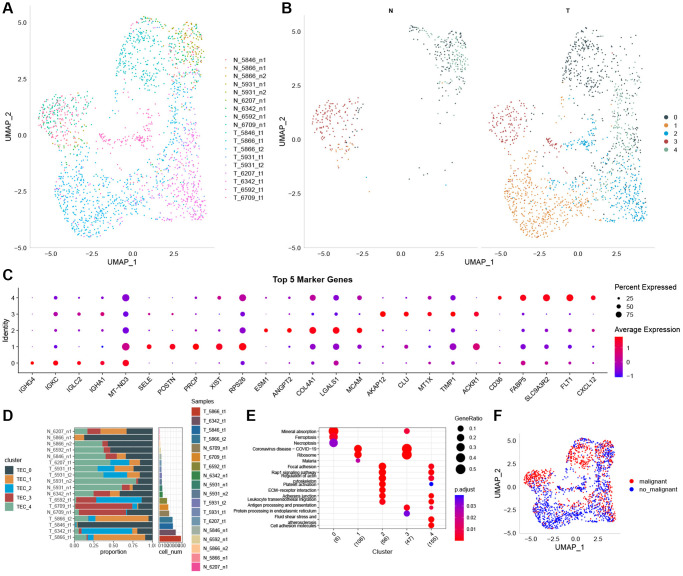
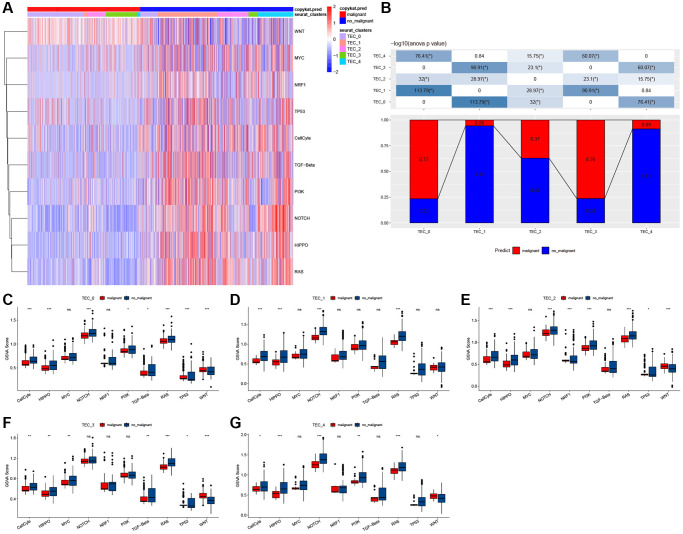
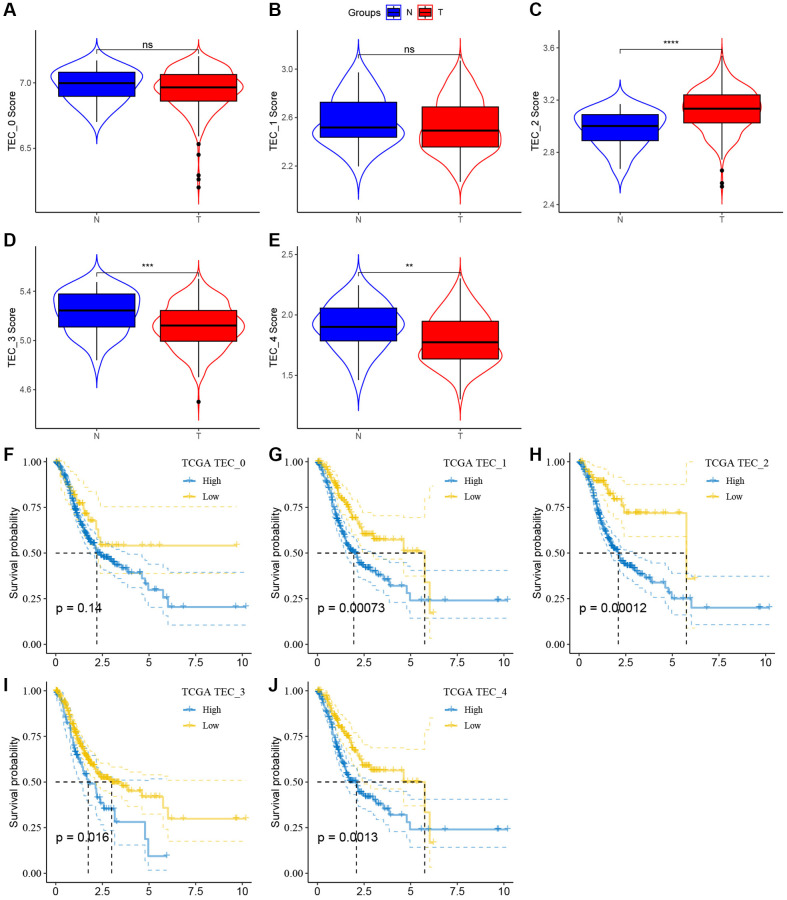
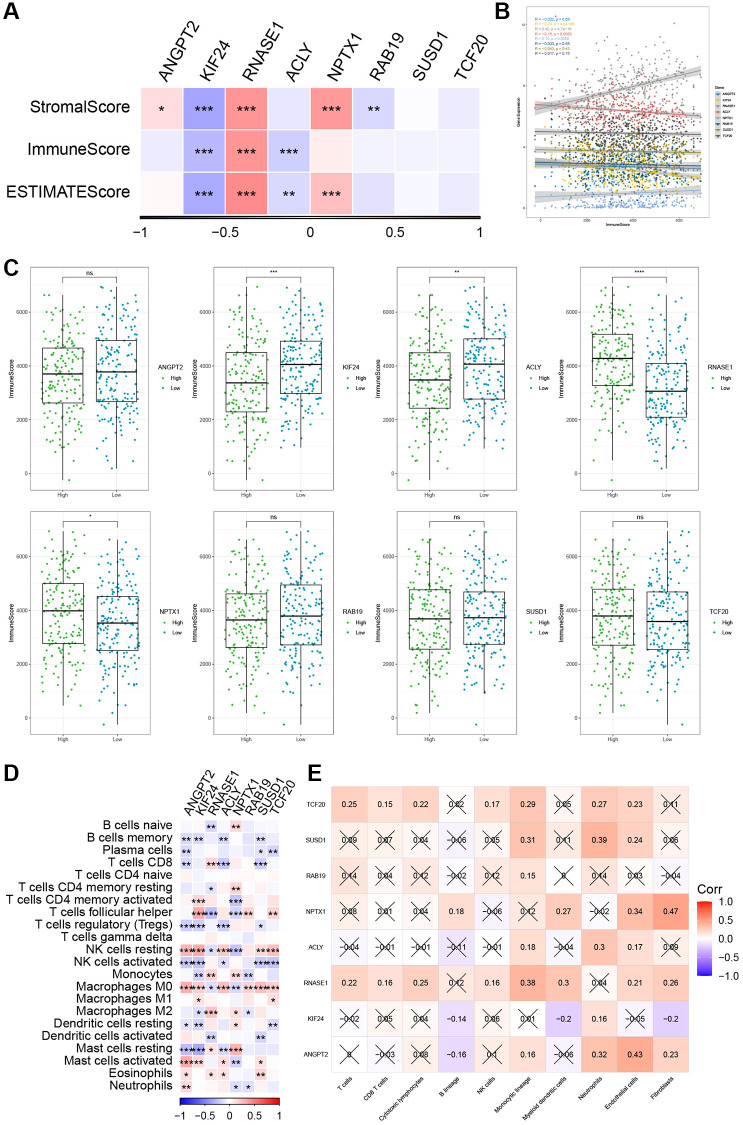
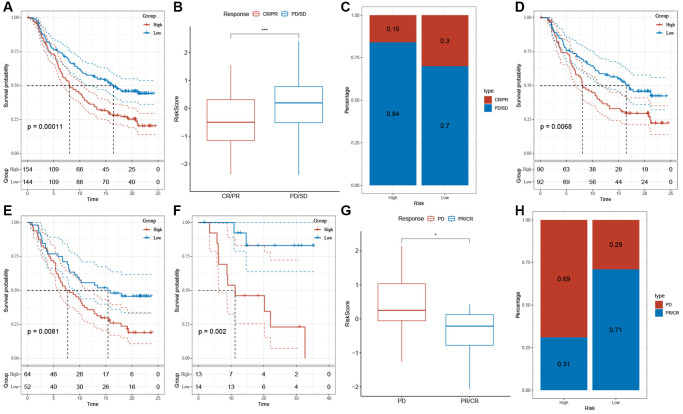
Results: Based on the scRNA-seq data, 5 TEC clusters were discovered in GC, with 3 of them showing prognostic associations in GC. A total of 163 genes were pinpointed among 3302 DEGs as significantly linked to TEC clusters, leading to the formulation of a risk signature comprising 8 genes. Furthermore, there was a notable correlation between the risk signature and the immune cell infiltration. Multivariate analysis findings indicated that the risk signature served as an independent prognostic factor for GC. Moreover, its efficacy in forecasting immune response was validated.
Conclusion: TEC-based risk model is highly effective in predicting the survival outcomes of GC patients and can forecast the immune response. Targeting TECs may significantly inhibit tumor progression and enhance the efficacy of immunotherapy.
Keywords: gastric cancer; immunotherapy; risk signature; tumor endothelial cells.
Conflict of interest statement
Figures
Similar articles
-
Revealing a cancer-associated fibroblast-based risk signature for pancreatic adenocarcinoma through single-cell and bulk RNA-seq analysis.Aging (Albany NY). 2024 Sep 26;16(18):12525-12542. doi: 10.18632/aging.206043. Epub 2024 Sep 26. Aging (Albany NY). 2024. PMID: 39332020 Free PMC article.
-
Integrated Analysis Construct a Tumor-Associated Macrophage Novel Signature with Promising Implications in Predicting the Prognosis and Immunotherapeutic Response of Gastric Cancer Patients.Dig Dis Sci. 2024 Jun;69(6):2055-2073. doi: 10.1007/s10620-024-08365-1. Epub 2024 Apr 4. Dig Dis Sci. 2024. PMID: 38573378
-
Targeting Tumor Differentiation Grade-related Genes Prognostic Signature Including COL5A1 Based on Single-cell RNA-seq in Gastric Cancer.Int J Med Sci. 2025 May 7;22(10):2533-2544. doi: 10.7150/ijms.107509. eCollection 2025. Int J Med Sci. 2025. PMID: 40386054 Free PMC article.
-
Single-cell RNA sequencing to map tumor heterogeneity in gastric carcinogenesis paving roads to individualized therapy.Cancer Immunol Immunother. 2024 Sep 13;73(11):233. doi: 10.1007/s00262-024-03820-4. Cancer Immunol Immunother. 2024. PMID: 39271545 Free PMC article. Review.
-
Exploring the current landscape of single-cell RNA sequencing applications in gastric cancer research.J Cell Mol Med. 2024 Apr;28(7):e18159. doi: 10.1111/jcmm.18159. J Cell Mol Med. 2024. PMID: 38494861 Free PMC article. Review.
Cited by
-
Molecular Mechanism for Malignant Progression of Gastric Cancer Within the Tumor Microenvironment.Int J Mol Sci. 2024 Oct 31;25(21):11735. doi: 10.3390/ijms252111735. Int J Mol Sci. 2024. PMID: 39519285 Free PMC article. Review.
-
Single-cell data revealed the regulatory mechanism of TNK cell heterogeneity in liver metastasis from gastric cancer.Discov Oncol. 2024 Nov 16;15(1):664. doi: 10.1007/s12672-024-01528-6. Discov Oncol. 2024. PMID: 39549183 Free PMC article.
-
In-depth insight into tumor-infiltrating stromal cells linked to tertiary lymphoid structures and their prospective function in cancer immunotherapy.Exp Hematol Oncol. 2025 Aug 10;14(1):105. doi: 10.1186/s40164-025-00695-8. Exp Hematol Oncol. 2025. PMID: 40784879 Free PMC article. Review.
References
MeSH terms
Substances
LinkOut - more resources
Full Text Sources
Medical
Miscellaneous
