. 2024 Jun 14;384(6701):eadh9979.
doi: 10.1126/science.adh9979. Epub 2024 Jun 14.

Integrated platform for multiscale molecular imaging and phenotyping of the human brain

Affiliations

Integrated platform for multiscale molecular imaging and phenotyping of the human brain

Juhyuk Park et al. Science. .

Abstract

Understanding cellular architectures and their connectivity is essential for interrogating system function and dysfunction. However, we lack technologies for mapping the multiscale details of individual cells and their connectivity in the human organ-scale system. We developed a platform that simultaneously extracts spatial, molecular, morphological, and connectivity information of individual cells from the same human brain. The platform includes three core elements: a vibrating microtome for ultraprecision slicing of large-scale tissues without losing cellular connectivity (MEGAtome), a polymer hydrogel-based tissue processing technology for multiplexed multiscale imaging of human organ-scale tissues (mELAST), and a computational pipeline for reconstructing three-dimensional connectivity across multiple brain slabs (UNSLICE). We applied this platform for analyzing human Alzheimer's disease pathology at multiple scales and demonstrating scalable neural connectivity mapping in the human brain.


Conflict of interest statement

Competing interests: K.C. is a co-inventor on patent applications owned by MIT covering the SHIELD and SWITCH technology (PCT/US2016/064538, “Methods for controlling chemical reaction kinetics and interaction time in large systems”), the MAP technology (US Provisional Patent Application 62/330,018, “Methods for reversible and tunable tissue magnification”), and the ELAST technology (US Patent Application 17/308,462, “Compositions and methods relating to reversibly compressible tissue-hydrogel hybrids”). K.C. and J.W. are co-inventors on patent applications owned by MIT covering the MEGAtome technology. MegaSPIM uses patented axial sweeping technology (US10989661B2, “Uniform and scalable light-sheets generated by extended focusing”). K.C. is a cofounder of LifeCanvas Technologies, a start-up that provides solutions for 3D tissue processing and analysis.

Figures

Fig. 1.
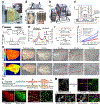
Fig. 1.. Integrated platform for multiscale molecular interrogation of the human brain.
(A) The workflow of the platform includes slicing, processing, labeling, imaging, and computational stitching of the human brain tissues. After magnetic resonance (MR) imaging, human brain hemispheres are sliced into millimeter-thick slabs using MEGAtome. The slabs are SHIELD-processed and transformed into mELAST tissue-hydrogels. The tough, elastic, and size-adjustable mELAST tissue-hydrogels undergo multiround labeling and imaging at multiple scales to extract high-dimensional features. The images acquired from the sliced human brain tissues are computationally reintegrated using the UNSLICE pipeline for multilevel connectivity mapping. (B) 3D multiscale profiling of the human brain captures brain-wide structures, cytoarchitecture and local circuitry, and cellular and subcellular features from the same tissue. Scale bars (from left to right): 5 cm, 300 μm, 25 μm, and 500 nm (inset: 25 nm).
Fig. 2.
Fig. 2.. Mechanical design and characterization of MEGAtome for scalable, information-lossless slicing.
(A) MEGAtome consists of two main modules: a blade vibration generation and control platform (in red frame) and a sample mounting and feeding platform (in blue frame). (B) The sample mounting and feeding platform is configured through two linear stages (LS1 and LS2). (C) MEGAtome-sliced whole human brain hemispheres and mouse brain arrays. (D and E) Mechanical design of the blade vibration generation and control mechanism shown in a 3D view (D) and in an xy plane (E). LDS, laser distance sensor; BMA, blade mounting assembly; VCA, voice coil actuator. (F) A single-DOF model (left, typical commercial vibratomes) and a multi-DOF model (right, MEGAtome), in which K1, K2, and K3 represent the stiffnesses of F1, F2, and F3, respectively. (G) Simulation results showing the forced vibration response of single- and multi-DOF systems. (H) Measurements of vibration amplitude and blade speed of x1 and x2 as functions of frequency (hertz). (I) Demonstration of ideal and real blade vibration accompanied by parasitic errors. (J) Measurements of blade out-of-plane parasitic vibration amplitude versus in-plane vibration amplitude of VT1200 vibratome and MEGAtome. (K) MEGAtome and VT1200 generated 1.0-, 0.2-, and 0.1-mm-thick slices from whole human cerebellums. The 1-mm-thick slices were scanned by an optical profiler showing the surface height variance. Scale bars: 10 mm (whole slice figures) and 2 mm (enlarged figures). (L) Images of NFH+ axons in the cut surfaces of human brain spinal cord tissues after MEGAtome slicing. Scale bars, 1 mm (left figures) and 40 μm (right enlarged figures). (M) Images of V5+ neurons in the PV-Cre MORF mouse brain tissues before and after MEGAtome slicing. Scale bars: 500 μm (top row) and 50 μm (bottom row). The images were obtained with the 20×/0.5 numerical aperture (NA) (L) and 4×/0.2NA objectives (M).
Fig. 3.
Fig. 3.. Large-scale slicing and high-throughput imaging of the whole human brain hemisphere and an array of animal organ–scale tissues.
(A) A schematic drawing of the whole mounting of an intact human brain hemisphere for MEGAtome slicing. To gel-embed a whole human brain hemisphere, liquid gel is first poured onto the hemisphere and then solidified, followed by chemical cross-linking of the gel with the brain in PFA (paraformaldehyde) solution. After sufficient cross-linking, the gel with the hemisphere [approximately 65 mm (width) by 180 mm (height) by 130 mm (length)] is mounted onto MEGAtome for slicing. (B) A banked human brain hemisphere was embedded in gel and subsequently sliced by MEGAtome. (C) MegaSPIM, a rapid, obliquely operated, multicolor light-sheet microscopy for imaging large-scale tissues. (D) A 4-mm-thick coronal human brain slab, encompassing multiple cortex regions, hippocampus, striatum, and thalamus, was SHIELD-cleared, immunostained with anti-NeuN antibodies, and imaged intact. Scale bar: 2 cm. (E) 3D image volume and enlarged xy plan views of NeuN+ cells from each brain region. Scale bars: 3 mm (top row) and 200 μm (bottom row). (F) A protocol for gel-embedding of animal organ arrays and their subsequent slicing: (i) Liquid gel is poured over the assembled tools, (ii) animal organs are positioned in the holder, (iii) the organs are completely immersed in extra liquid gel, (iv) the gel-organ mixture is solidified and fixed in PFA, and (v) MEGAtome slices the array. (G) Images of NeuN+ neurons from the arrays of 35 mouse brains and six marmoset hemispheres. Scale bars: 3 mm (second column) and 500 mm (enlarged view). The images were obtained with the 2×/0.1NA objective [(D), (E), and (G)]. Anatomical annotations in (D) are from Allen Brain Reference Atlases (Adult Human, Modified Brodmann; http://atlas.brain-map.org) (83).
Fig. 4.
Fig. 4.. mELAST tissue-hydrogel processing platform for multiplexed multiscale molecular imaging of the human brain.
(A) The workflow of mELAST tissue-hydrogel processing for an intact coronal human brain slab. Scale bar: 2 cm. (B) The elastic and expandable mELAST human brain tissue-hydrogel. Scale bar: 1 cm. (C) Expansion ratios of PFA tissues and mELAST tissue-hydrogels in 1XPBS (phosphate-buffered saline) and water. L0 is the mean length of the original brain, and L is the mean length in 1XPBS or water. Error bars show mean ± SD (n = 5). (D) A photobleaching device to remove autofluorescence from lipofuscin and other autofluorescence pigments in human brain tissues. (E) Images and mean pixel values of the background autofluorescence signal from human brain tissues captured by MegaSPIM before and after photobleaching. Scale bar: 300 μm. a.u., arbitrary units. Error bars show mean ± SD (n = 6). (F) Images of immunolabeled CR+ neurons from the photobleached and nonphotobleached human brain tissues. The graph shows the signal intensity measured from the yellow dashed lines in each image. Scale bar: 100 μm. (G) A human brain–scale tissue pump for accelerated clearing, washing, staining, and destaining of large-scale mELAST tissue-hydrogels. (H) A graph measures the distance between the pump head and the chamber floor during the operation of the pump. The inset graph shows the enlarged view. (I) Multiscale imaging of an mELAST-processed and SWITCH-pumping-stained intact coronal human brain hemisphere tissue (size in 5.8 cm by 4.2 cm by 2.5 mm). Each red arrowhead indicates the magnified area within the insets. Scale bars (top to bottom): 5 mm, 1 mm, 200 μm, and 20 μm. (J) Highly multiplexed imaging of an mELAST human brain tissue, simultaneously mapping neuronal and non-neuronal cell subtypes. Scale bars: 2 mm (left figure) and 100 μm (enlarged view). The images were obtained with the 2×/0.1NA [(E), (I) i, ii, iii, and (J)], 20×/0.5NA (F), and 16.7×/0.4NA objectives [(I), iv].
Fig. 5.
Fig. 5.. Comparative single-cell resolution imaging and phenotyping of the human brains.
(A and B) Holistic quantitative analysis of individual cells in large tissue volumes. (A) Images of immunolabeled NeuN+ cells in the slabs that include cerebral gyri [superior frontal gyrus (SFG), rostral gyrus (RoG), cingulate gyrus (CgG), gyrus rectus (ReG), orbital gyrus (OrG), and mid frontal gyrus (MFG)], from both control and AD cases. (i) Segmented cortical subregions in the whole slab images, (ii) enlarged views of orbitofrontal cortex (OFC) from OrG, and (iii) NeuN+ cells detected and automatically counted for each cortex subregion. Scale bars: 1 cm (first column), 500 μm (third column), and 100 μm (fourth and fifth columns). (B) The graphs show number and density of NeuN+ cells across each brain subregion of the two cases. (C and D) Multiplexed staining and imaging of mELAST-processed human brain tissues from the OFC in control and AD slabs, described in (A): nuclei (YOYO-1), neuronal subtypes (PV, CR, NPY, and SST), astrocytes (GFAP), microglia (Iba1), oligodendrocytes (MBP), axons (pNFP), endothelial cells (CD31), senile plaques (Aβ), and neurofibril tangles (pTau). Scale bar: 200 μm. (E) Comparative signal intensity profiles of GFAP, Aβ, and pTau across the cortical column from the two cases. (F and G) pNFP+ cortical fiber orientation analysis. WM: White matter. (F) Representative images of pNFP+ fibers throughout the cortex of the control and AD tissues (yellow arrows represent the pial surface direction). Scale bar: 300 μm. (G) Histograms of the angular orientation of pNFP+ fibers with respect to the cortical column direction (θ) in the control and AD tissues. (H) Layer-specific comparison of the density and distribution of (i) YOYO-1; (ii) PV+, CR+, NPY+, SST+, CR+/PV+ neurons; and (iii) Iba1+ microglia in the OFC of the control and AD tissues. (I) Analysis of the spatial distribution pattern of cells associated with pTau and pNFP. Layer-specific comparison of (i) cell density and (ii) proportion of each subtype of pTau+/pNFP−, pTau−/pNFP+, and pTau+/pNFP+ cells in each layer. The images were obtained with the 2×/0.1NA objective [(A), (C), (D), and (F)].
Fig. 6.
Fig. 6.. Comparative subcellular resolution imaging and phenotyping of the human brains.
(A) Fine morphological details of cells in the same expanded mELAST tissue-hydrogels (layer III) described in Fig. 5, C and D. Scale bar: 50 μm. (B to E) Comparison of the detailed morphology of each cell type, illustrated with representative 3D rendering images: (B) Iba1+ microglia and associated Aβ plaques (scale bar, 20 μm), (C) GFAP+ astrocytes (scale bar, 50 μm), (D) CR+ and CR+/PV+ neurons (scale bar, 20 μm), and (E) pTau+ cells and fibers (scale bar, 20 μm). (F) Cell density of each glia type classified on the basis of its morphology. (G) Percentages of CR+ interneurons in the control and AD cases, classified by their dendrite morphology: bipolar, bitufted, multipolar (n = 3), and multipolar (n > 3). (H to J) Multiscale imaging and analysis of axonal damage. (H) Representative single-cell resolution images of pNFP+ axons, MBP+ oligodendrocytes, pTau+ fibers, and Aβ plaques. Scale bar: 50 μm. (I) Analysis of MBP pixel density from regions inside and outside Aβ plaques in the control and AD tissues. Error bars show mean ± SD (n = 10). (J) pNFP+ axon and MBP+ oligodendrocyte morphology at the subcellular level, represented by the marked region in (H). Scale bars: 5 μm (left figure) and 20 mm (right figure). (K) Distribution of thickness of representative pNFP+ axons in the control and AD tissues (n = 50). (L) 3D mapping of nanoscopic chemical synapses (Syn I/II and PSD-95) and Aβ+ plaques in the same 4.5× expanded control and AD mELAST-processed human brain tissue-hydrogels described in (A). Scale bars: 5 μm and 500 nm (zoom-in view). (M) Comparison of the density of Syn I/II and PSD-95 in the control and AD tissues, both inside and outside Aβ plaques. Error bars show mean ± SD (n = 10). The images were obtained with the 2×/0.1NA (H), 16.7×/0.4NA [(A) to (E), and (J)], and 63×/1.2NA objectives (L).
Fig. 7.
Fig. 7.. UNSLICE computational pipeline for accurate multilevel interslab registration of the large-scale sliced tissue blocks.
(A) Schematic of the UNSLICE pipeline. (B) 3D reconstruction of genetically labeled PV+ neurons in MORF mouse brains using UNSLICE. Scale bars: 500 μm (macroscopic view) and 50 μm (zoom-in views). (C) Quantification of the distance (error) between fiber endpoints at the cut surface in three sampled subsections, based on ground-truth image data before and after slicing at cellular resolution (average error: ~1.29 μm). (D) UNSLICE registration of two adjacent coronal human brain hemisphere slabs, based on vascular endpoints (lectin channel) of the consecutive slabs (xy and xz optical cross sections). Scale bar: 2 mm. Inset images show blood vessels connected across the cut surface. Scale bar: 2 mm. (E) 3D rendering of a fully reconstructed human pons. Scale bar: 1 cm. A zoomed-in view of the xz plane to show the registered vasculature at multiple interfaces. Scale bar: 500 μm. The images were obtained with the 2×/0.1NA [(D) and (E)] and 4×/0.2NA (B) objectives.
Fig. 8.
Fig. 8.. Multichannel interslab registration and volumetric axon tracing for single-fiber–level connectivity mapping in the human brain.
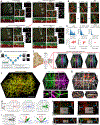
(A) Multichannel interslab registration at single-fiber resolution using NFH+ and GFAP+ fibers within a single field of view of the larger cortical tissue. Scale bar: 100 μm. Inset images depict maximum intensity projections (MIP) of NFH+ and GFAP+ fibers in xz and xy planes. (B) NFH+ fibers from the same field of view to show progression of co-registration during each registration step, including vasculature (lectin) registration, PV/GFAP fine-tuning, and NFH fine-tuning. (C) Histogram of absolute errors (top) and x-y lateral connectivity errors (bottom) for NFH+ fibers during each registration step. (D to J) pTau+ fiber mapping and phenotyping in AD human brain tissue. (D) A deep-learning based axon tracing algorithm for end-to-end detection of axon centerlines using a residual 3D U-Net architecture. (E) An mELAST-processed AD human brain tissue was reconstructed with UNSLICE at single-fiber level. Scale bar: 0.5 mm. (F) Automated volumetric tracing of pTau+ fibers across cut human brain tissue slices. The right figure and zoomed insets i to iii show MIP overlaid with tracing results. Scale bar: 150 μm. (G) An Aβ (red)/pTau (grayscale) overlay of the same subvolume from (F). Insets i and ii: zoomed-in subvolumes depicting two segmented long traced pTau+ fibers among Aβ plaques. Scale bar: 150 μm. (H) pTau+ fiber orientation histogram of the traced fibers from the subvolume in (F), binned by polar (φ) and azimuthal angle (θ). The thickness of each vector was proportional to fiber counts in each direction. (I) Histograms from (H) projected into the 2D xy, xz, and yz planes. (J) The xy and xz plane views to show the fiber orientation to the cortical column. The images were obtained with the 20×/0.5NA [(A) and (B)] and 16.7×/0.4NA [(E) to (G), and (J)] objectives.

Similar articles

Cited by

References

    1. Biswal BB et al., Toward discovery science of human brain function. Proc. Natl. Acad. Sci. U.S.A. 107, 4734–4739 (2010). doi: 10.1073/pnas.0911855107 - DOI - PMC - PubMed
    1. Bassett DS, Gazzaniga MS, Understanding complexity in the human brain. Trends Cogn. Sci. 15, 200–209 (2011). doi: 10.1016/j.tics.2011.03.006 - DOI - PMC - PubMed
    1. Hawrylycz MJ et al., An anatomically comprehensive atlas of the adult human brain transcriptome. Nature 489, 391–399 (2012). doi: 10.1038/nature11405 - DOI - PMC - PubMed
    1. Glover P, Bowtell R, Medical imaging: MRI rides the wave. Nature 457, 971–972 (2009). doi: 10.1038/457971a - DOI - PubMed
    1. Evans AC, Janke AL, Collins DL, Baillet S, Brain templates and atlases. Neuroimage 62, 911–922 (2012). doi: 10.1016/j.neuroimage.2012.01.024 - DOI - PubMed

Publication types