

Association of Cortical Lesions With Regional Glutamate, GABA, N-Acetylaspartate, and Myoinositol Levels in Patients With Multiple Sclerosis
- PMID: 38870443
- PMCID: PMC11244746
- DOI: 10.1212/WNL.0000000000209543
Association of Cortical Lesions With Regional Glutamate, GABA, N-Acetylaspartate, and Myoinositol Levels in Patients With Multiple Sclerosis
Abstract
Background and objectives: Cortical lesions contribute to disability in multiple sclerosis (MS), but their impact on regional neurotransmitter levels remains to be clarified. We tested the hypothesis that cortical lesions are associated with regional glutamate and gamma-aminobutyric acid (GABA) concentrations within the affected cortical region.
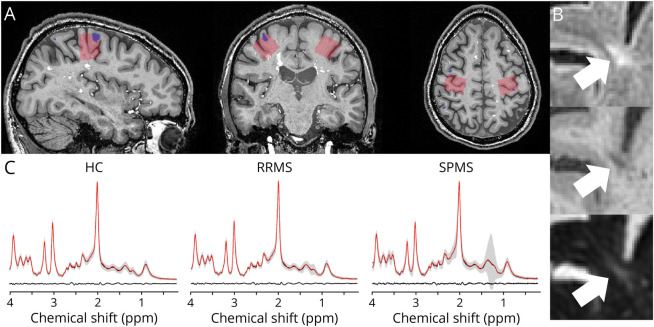
Methods: In this cross-sectional study, we used structural 7T MRI to segment cortical lesions and 7T proton MR-spectroscopy of the bilateral sensorimotor hand areas to quantify regional GABA, glutamate, N-acetylaspartate, and myoinositol concentrations in patients with MS (inclusion criteria: diagnosis of relapsing-remitting [RR] or secondary progressive MS [SPMS]; age 18-80 years) and age and sex-matched healthy controls. Data were collected at a single center between August 2018 and September 2020. Linear mixed-effects models were used to test for associations between metabolite concentrations and cortical lesion volumes within the same MR-spectroscopy voxel.
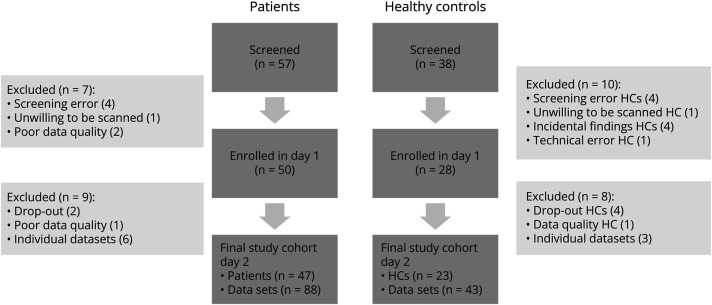
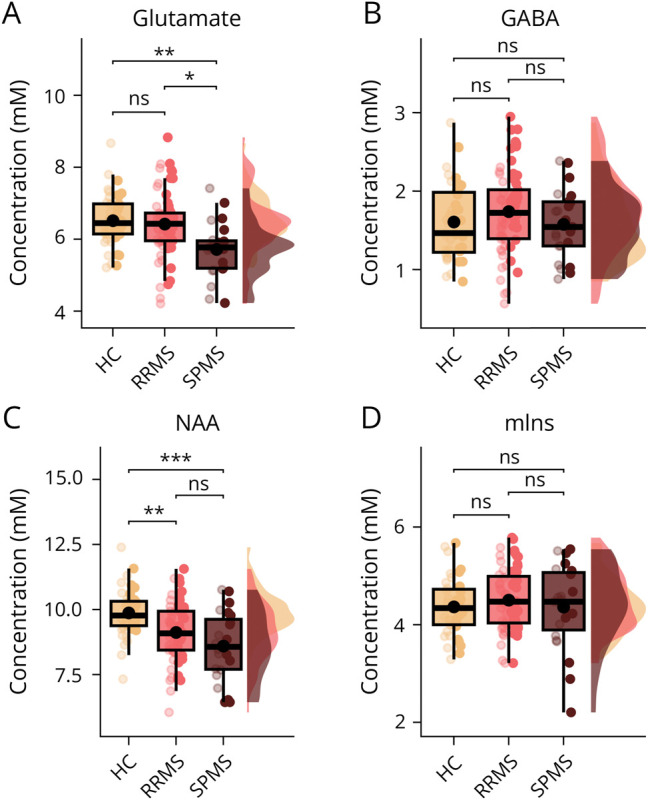
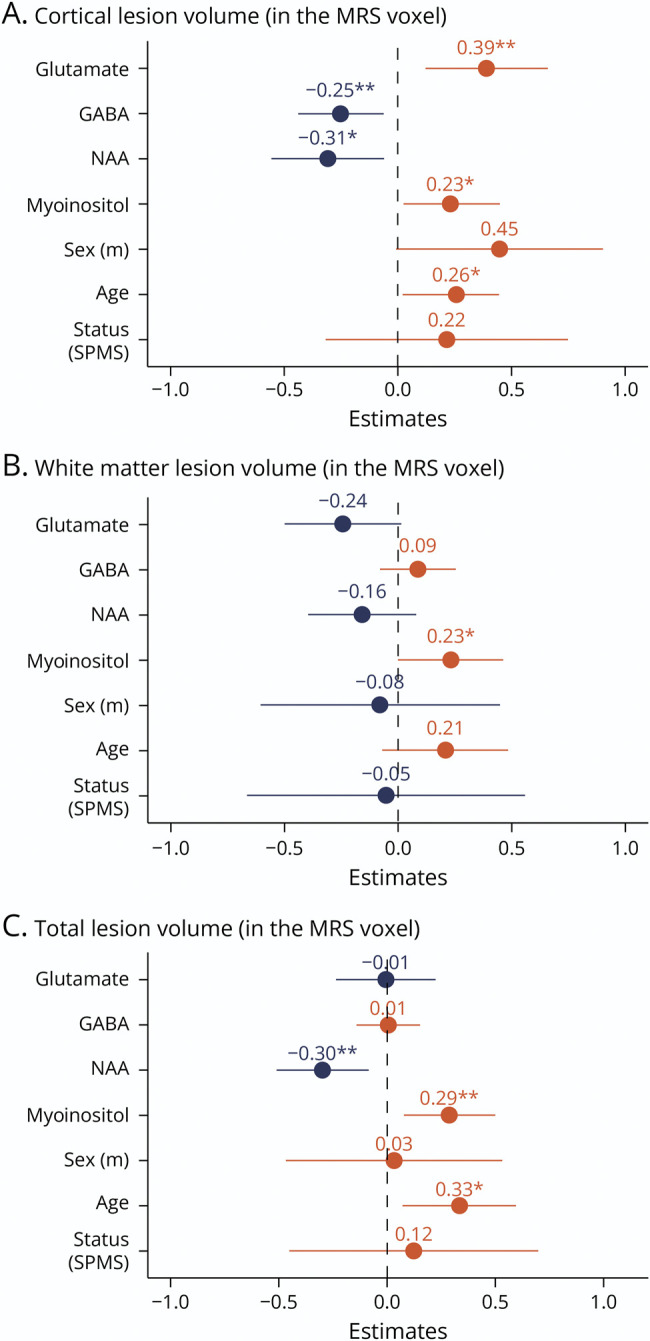
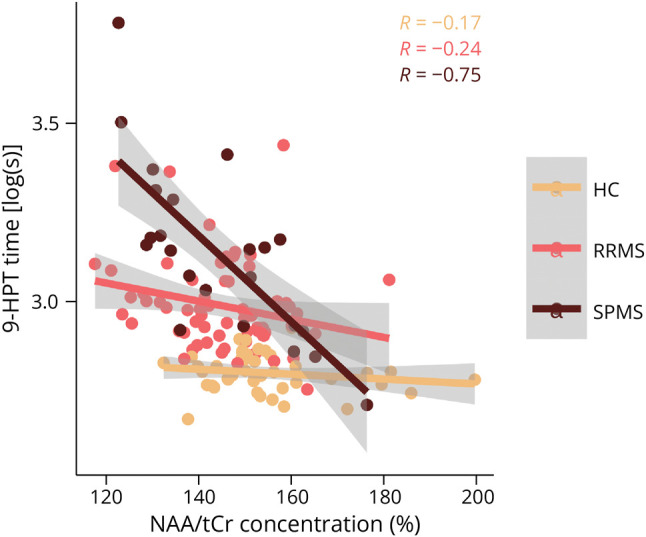
Results: Forty-seven patients with MS (34 RRMS, 13 SPMS; 45.1 ± 12.5 years; 31 women) and 23 healthy controls (44.4 ± 13 years, 15 women) were studied. In patients, higher regional glutamate and lower regional GABA concentrations were associated with larger cortical lesion volume within the MR-spectroscopy voxel [glutamate: 0.61 (95% CI 0.19-1.03) log(mm3), p = 0.005, GABA: -0.71 (-1.24 to -0.18) log(mm3), p = 0.01]. In addition, lower N-acetylaspartate levels [-0.37 (-0.67 to -0.07) log(mm3), p = 0.016] and higher myoinositol levels [0.48 (0.03-0.93) log(mm3), p = 0.037] were associated with a larger regional cortical lesion volume. Furthermore, glutamate concentrations were reduced in patients with SPMS compared with healthy participants [-0.75 (-1.3 to -0.19) mM, p = 0.005] and patients with RRMS [-0.55 (-1.07 to -0.02) mM, p = 0.04]. N-acetylaspartate levels were lower in both patients with RRMS [-0.81 (-1.39 to -0.24) mM, p = 0.003] and SPMS [-1.31 (-2.07 to -0.54) mM, p < 0.001] when compared with healthy controls. Creatine-normalized N-acetylaspartate levels were associated with performance in the 9-hole peg test of the contralateral hand [-0.004 (-0.007 to -0.002) log(s), p = 0.002], and reduced mean creatine-normalized glutamate was associated with increased Expanded Disability Status Scale (R = -0.39, p = 0.02).
Discussion: Cortical lesions are associated with local increases in glutamate and a reduction in GABA concentration within the lesional or perilesional tissue. Further studies are needed to investigate the causal relationship between cortical lesions and changes in neurotransmitter concentrations.
Conflict of interest statement
M.A.J. Madsen, M. Povazan, and V. Wiggermann have nothing to declare; H.R. Siebner has received honoraria as speaker from Sanofi Genzyme, Denmark, and Novartis, Denmark, as consultant for Sanofi Genzyme, Denmark, and Lundbeck AS, Denmark, and as editor-in-chief (Neuroimage Clinical) and senior editor (NeuroImage) from Elsevier Publishers, Amsterdam, the Netherlands. He has received royalties as book editor from Springer Publishers, Stuttgart, Germany, and from Gyldendal Publishers, Copenhagen, Denmark; H. Lundell is inventor on 2 patent applications with royalty agreement with RWI AB, Lund, Sweden; F. Sellebjerg has served on scientific advisory boards for, served as consultant for, received support for congress participation, or received speaker honoraria from Alexion, Biogen, Bristol Myers Squibb, H. Lundbeck A/S, Merck, Novartis, Roche, and Sanofi Genzyme. His laboratory has received research support from Biogen, Merck, Novartis, Roche, and Sanofi Genzyme; J.R. Christensen has received speaker honoraria from Biogen; M. Blinkenberg reports personal fees from the Danish Multiple Sclerosis Society, Biogen, Sanofi Genzyme, Biogen, Merck, Novartis, Bristol-Myers Squibb, Roche, and nonfinancial support from Biogen, Roche, and Sanofi Genzyme. Go to
Figures
Similar articles
-
[Proton magnetic-resonance spectroscopy in remitting and secondary-progressive multiple sclerosis].Zh Nevrol Psikhiatr Im S S Korsakova. 2001;101(4):36-9. Zh Nevrol Psikhiatr Im S S Korsakova. 2001. PMID: 11490432 Russian.
-
Hypothalamic damage in multiple sclerosis correlates with disease activity, disability, depression, and fatigue.Neurol Res. 2017 Apr;39(4):323-330. doi: 10.1080/01616412.2016.1275460. Epub 2017 Feb 13. Neurol Res. 2017. PMID: 28191860
-
Gray matter N-acetyl aspartate deficits in secondary progressive but not relapsing-remitting multiple sclerosis.AJNR Am J Neuroradiol. 2003 Nov-Dec;24(10):1941-5. AJNR Am J Neuroradiol. 2003. PMID: 14625214 Free PMC article.
-
Imaging cortical multiple sclerosis lesions with ultra-high field MRI.Neuroimage Clin. 2021;32:102847. doi: 10.1016/j.nicl.2021.102847. Epub 2021 Oct 6. Neuroimage Clin. 2021. PMID: 34653837 Free PMC article.
-
Diagnosis of multiple sclerosis through the lens of ultra-high-field MRI.J Magn Reson. 2018 Jun;291:101-109. doi: 10.1016/j.jmr.2018.01.022. Epub 2018 Apr 26. J Magn Reson. 2018. PMID: 29705032 Free PMC article. Review.
Cited by
-
Fluid Biomarkers in Demyelinating Spectrum Disorders: Past, Present, and Prospects.Int J Mol Sci. 2025 May 7;26(9):4455. doi: 10.3390/ijms26094455. Int J Mol Sci. 2025. PMID: 40362691 Free PMC article. Review.
References
MeSH terms
Substances
LinkOut - more resources
Full Text Sources