. 2024 Jul 8;10(7):4279-4296.
doi: 10.1021/acsbiomaterials.4c00229. Epub 2024 Jun 13.

Mechanobiological Modulation of In Vitro Astrocyte Reactivity Using Variable Gel Stiffness

Affiliations

Mechanobiological Modulation of In Vitro Astrocyte Reactivity Using Variable Gel Stiffness

Julia C Benincasa et al. ACS Biomater Sci Eng. .

Abstract

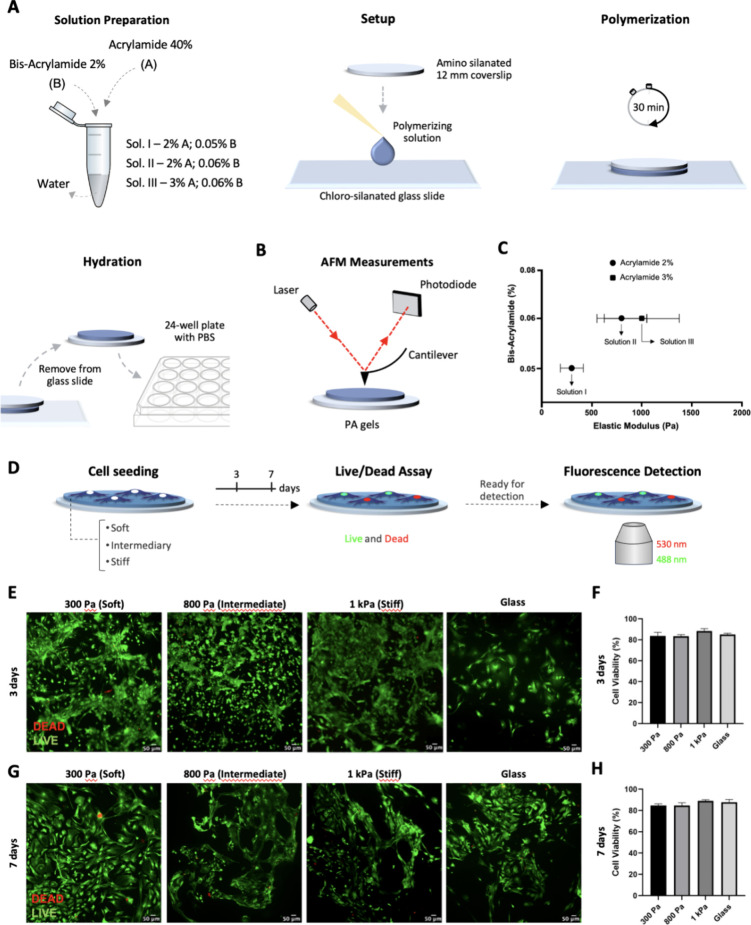
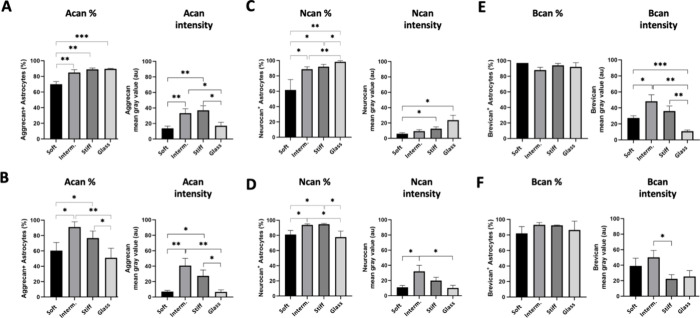
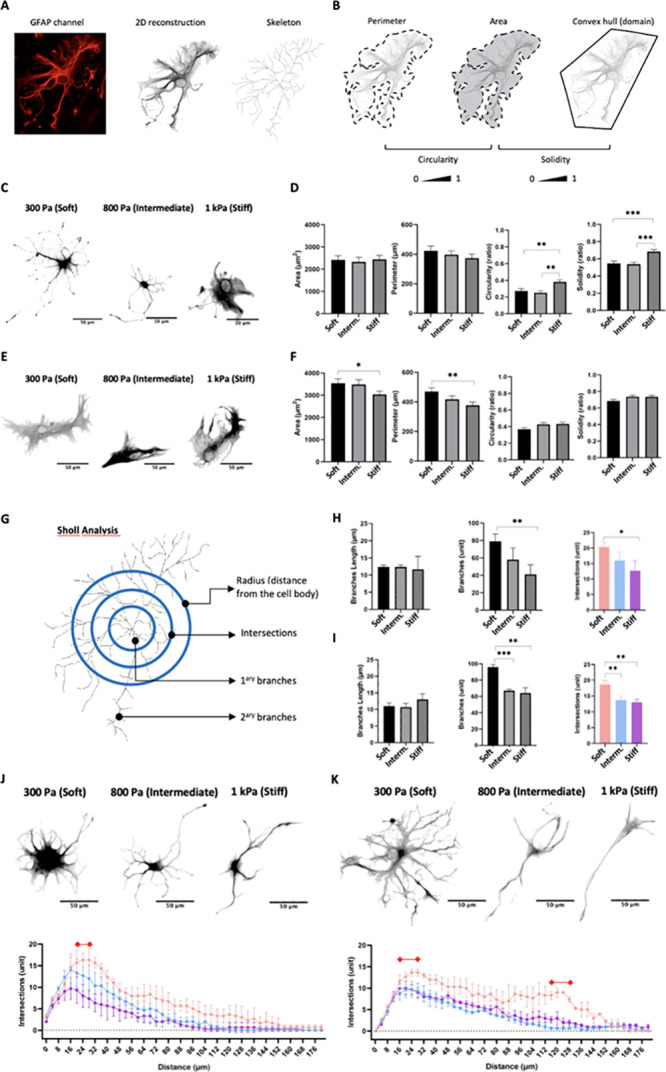
After traumatic brain injury, the brain extracellular matrix undergoes structural rearrangement due to changes in matrix composition, activation of proteases, and deposition of chondroitin sulfate proteoglycans by reactive astrocytes to produce the glial scar. These changes lead to a softening of the tissue, where the stiffness of the contusion "core" and peripheral "pericontusional" regions becomes softer than that of healthy tissue. Pioneering mechanotransduction studies have shown that soft substrates upregulate intermediate filament proteins in reactive astrocytes; however, many other aspects of astrocyte biology remain unclear. Here, we developed a platform for the culture of cortical astrocytes using polyacrylamide (PA) gels of varying stiffness (measured in Pascal; Pa) to mimic injury-related regions in order to investigate the effects of tissue stiffness on astrocyte reactivity and morphology. Our results show that substrate stiffness influences astrocyte phenotype; soft 300 Pa substrates led to increased GFAP immunoreactivity, proliferation, and complexity of processes. Intermediate 800 Pa substrates increased Aggrecan+, Brevican+, and Neurocan+ astrocytes. The stiffest 1 kPa substrates led to astrocytes with basal morphologies, similar to a physiological state. These results advance our understanding of astrocyte mechanotransduction processes and provide evidence of how substrates with engineered stiffness can mimic the injury microenvironment.

Keywords: astrocyte morphology; astrogliosis; glial scar; matrix stiffness; polyacrylamide gels.


Conflict of interest statement

The authors declare no competing financial interest.

Figures

Figure 1
Figure 1
Scheme of Elastic Modulus evaluation of PA-gels and cell viability. (A) Scheme of acrylamide and bis-acrylamide combination to produce three solutions. The setup includes a presilanated coverslip, polymerizing solution, and chloro-silanated glass slide. Gel is allowed to polymerize between the coverslip and glass slide, and PBS is added for hydration. (B) Gel measurement using atomic force microscopy involves a sharp probe touching the gel surface, causing the cantilever to bend, which is then detected by changes in the laser light path read by a photodiode. (C) Graph of elastic modulus of the three hydrogels (±SD error bars, n = 3). The mechanical properties of the hydrogels were 300 Pa (soft), 800 (intermediate), and 1k Pa (stiff). (D) Scheme of primary astrocytes cultured on PA-gels and control group submitted to cell viability assay and analyzed 3- and 7-dps. (E) Representative images of live (green) and dead (red) cells on each group, 3-dps. (F) Graph bar shows quantitative analysis expressed in percentage of live cells, 3-dps (mean, ± SD error bars, n = 3). (G) Representative images of live (green) and dead (red) cells on each group, 7-dps. (H) Graph shows quantitative analysis expressed in percentage of live cells, 7-dps (mean, ± SD error bars, n = 3). Data was analyzed using one-way ANOVA followed by Tukey’s multiple comparison tests. Values with p < 0.05 were considered statistically significant. Scale bar 50 μm.
Figure 2
Figure 2
Astrocyte immunocharacterization and reactive response on PA-gel-based microenvironment platforms and glass (control group) 3-pds. (A) Representative images of GFAP and S100β immunolabeling. (B) Graph bar shows quantitative analysis of GFAP+ cells, expressed in percentage (mean, ± SD error bars, n = 3) and immunolabeling intensity (mean, ± SEM error bars, n = 3). (C) Quantitative analysis of S100β+ cells, expressed in percentage (mean, ± SD error bars, n = 3), and S100β immunolabeling intensity (mean, ± SEM error bars, n = 3). Data was analyzed using one-way ANOVA followed by Tukey’s multiple comparison tests. Values with p < 0.05 were considered statistically significant. Scale bar 50 μm.
Figure 3
Figure 3
Astrocyte immunocharacterization and reactive response on PA-gel-based microenvironment platforms and glass (control group) 7-dps. (A) Representative images of GFAP and S100β immunolabeling. (B) Graph bar shows quantitative analysis of GFAP+ cells, expressed in percentage (mean, ± SD error bars, n = 3) and immunolabeling intensity (mean, ± SEM error bars, n = 3). (C) Quantitative analysis of S100β+ cells, expressed in percentage (mean, ± SD error bars, n = 3), and S100β immunolabeling intensity (mean, ± SEM error bars, n = 3). Data was analyzed using one-way ANOVA followed by Tukey’s multiple comparison tests. Values with p < 0.05 were considered statistically significant. Scale bar 50 μm.
Figure 4
Figure 4
Proliferative response of astrocytes on PA-gels-based microenvironment platforms. (A) Scheme of primary cultures of astrocytes on PA-gels and analysis (3- and 7-dps). Astrocytes seeded on soft-, intermediate-, and stiff- PA-gels 3- and 7-dps. After incubation with EdU, cells were immunolabeled and counterstained with Hoechst. The ratio EdU+ (representing the newly proliferative cells)/Hoechst (representing the totality of cells) was measured to obtain the percentage of proliferative cells in groups. (B) Representative images of proliferation response after 3-dps. (C) Graph shows quantitative analysis of EdU+, 3-dps expressed in percentage (mean, ± SD error bars, n = 3). (D) Representative images of proliferation response, 7-dps. (E) Graph shows quantitative analysis of EdU+, 7-dps, expressed in percentage (mean, ± SD error bars, n = 3). Data was analyzed using one-way ANOVA followed by Tukey’s multiple comparison tests. Values with p < 0.05 were considered statistically significant. Scale bar 50 μm.
Figure 5
Figure 5
Analysis of cell population distribution considering density, mean neighbor distances, and distribution of astrocytes on PA-gel-based microenvironment platforms. (A) Representative images were transformed into masks and used for the near neighbor distance ratio (NND ratio) plug-in to measure the mean distance between cells and their density for response distribution. Results were categorized as aggregate, clumped, or nonpatterned when NND ratio was <1, and as uniform or patterned when NND > 1. (B) Representative images of the “masks” for each PA-gel group, 3-dps. (C) Graph bar of the density (mean, ± SEM error bars, n = 3), the mean distance between the cells (mean, ± SEM error bars, n = 3), and the NND ratio (mean, ± SD error bars, n = 3), 3-dps. (D) Representative images of the “masks” for each PA-gel group, 7-dps. (E) Graph bar of the density (mean, ± SEM error bars, n = 3), the average distance between the cells (mean, ± SEM error bars, n = 3), and the NND ratio (mean, ± SD error bars, n = 3), 7-dps. Data was analyzed using one-way ANOVA followed by Tukey’s multiple comparison tests. Values with p < 0.05 were considered statistically significant.
Figure 6
Figure 6
Evaluation of the response of astrocytes to express CSPG on PA-gel-based microenvironment platforms. (A) Graph shows a quantitative analysis of Acan+ (right), expressed in percentage (mean, ± SD error bars, n = 3), and Acan intensity (left) 3-dps (mean, ± SD error bars, n = 3). (B) Graph shows a quantitative analysis of Acan+ (right) expressed in percentage (mean, ± SD error bars, n = 3), and Acan intensity (left) 7-dps (mean, ± SD error bars, n = 3). (C) Graph shows a quantitative analysis of Ncan+ (right), expressed in percentage (mean, ± SD error bars, n = 3), and Ncan intensity (left) 3-dps (mean, ± SD error bars, n = 3). (D) Graph shows a quantitative analysis of Ncan+ (right), expressed in percentage (mean, ± SD error bars, n = 3), and Ncan intensity (left) 7-dps (mean, ± SD error bars, n = 3). (E) Graph shows a quantitative analysis of Bcan+ (right), expressed in percentage (mean, ± SD error bars, n = 3), and Acan intensity (left) 3-dps (mean, ± SD error bars, n = 3). (F) Graph shows a quantitative analysis of Acan+ (right), expressed in percentage (mean, ± SD error bars, n = 3), and Acan intensity (left) 7-dps (mean, ± SD error bars, n = 3). Statistical analysis was by one-way ANOVA with multiple comparisons of Tukey’s posthoc, and values with p < 0.05 were considered statistically significant.
Figure 7
Figure 7
Bcan, Acan – C-type lectin core proteins, KOG4297 – and Ncan – nonsupervised orthologous group, NOG0089622 – interaction network and gene coexpression analyses. (A) Protein–protein network analysis displayed major clusters (green, red, and blue) for Bcan and Acan -C-type lectin family- proteins. Edges are represented as protein associations that are meant to be meaningful. Green cluster showed stronger and major protein–protein interactions. (B) Gene coexpression analysis displayed high association scores (AS) with Annexin A2 and S100-A10 (AS = 0.764). Abbreviations: COG5599: Protein Tyrosine Phosphatase; KOG0819: Annexin; KOG2579: Ficolin and related extracellular proteins; KOG3587: Galectin and Galactose-binding Lectin; KOG3714: Meprin A Metalloprotease; KOG4297: C-type lectin; NOG008962: nonsupervised orthologous group (comprehending the Ncan core protein); and NOG038821: nonsupervised orthologous group. (C) Protein–protein network analysis displayed major clusters (green, red, and blue). Edges represent protein–protein associations that are meant to be specific and meaningful, the green cluster showed stronger and major protein–protein interactions. (D) Gene coexpression analysis displayed high association scores (AS) with β2-glycoprotein 1 (APOH) and tyrosinase (TYR, AS = 0.764); and transmembrane protein 212 (TMEM 212) and fibrous sheath-interacting protein 2 (FSIP2, AS = 0.623). Abbreviations: COG5083: phosphatidate phosphatase PAH1; COG5640: secreted trypsin-like serine protease; KOG3544: collagens (type IV and type XIII); and KOG4297: C-type lectin (comprehending Bcan and Acan core proteins).
Figure 8
Figure 8
Distribution of astrocyte morphologies on PA-gel-based microenvironment platforms. (A) Representative images of the reconstructions of astrocytes in each PA-gel group. (B) Graph shows quantitative analysis of the morphologies in each group, 3-dps, expressed in percentage (mean, ± SEM error bars, n = 3). (C) Graph shows quantitative analysis of the morphologies in each group, 7-dps, expressed in percentage (mean, ± SEM error bars, n = 3). Statistical analysis was by two-way ANOVA (using “stiffness” and “morphologies” as factor 1 and 2, respectively) with multiple comparisons of Tukey’s posthoc, and values with p < 0.05 were considered statistically significant. Scale bar 50 μm.
Figure 9
Figure 9
Morphometric analysis of astrocytes on PA-gel-based microenvironment platforms. (A) GFAP channels were converted into 8-bits images and, using SNT plug-in, 2D reconstructions and skeletons of the cells were generated. (B) Morphometric analyses using 2D parameters: perimeter, area, and convex hull area. These values estimate circularity, area, and solidity, respectively. (C) Representative images of 2D reconstructions of astrocytes highlight the morphological differences on each substrate 3-dps. (D) Graphs show quantitative analysis of 2D morphological parameters (area, perimeter, circularity, and solidity) to evaluate astrocyte response to each PA-gel 3-dps (mean, ± SEM error bars, n = 3). (E) Representative images of 2D reconstructions of astrocytes highlighting the morphological differences on each substrate 7-dps. (F) Graphs show quantitative analysis of 2D morphological parameters (area, perimeter, circularity, and solidity) to evaluate astrocyte response to each PA-gel 7-dps (mean, ± SEM error bars, n = 3). (G) Scheme of Sholl analysis employed to assess cell complexity by determining intersections, primary and secondary branches, and the distance (radius*) from the cell body. (H) Morphometric quantification of process length and the number of branch points, 3-dps (mean, ± SD error bars, n = 3). (I) Morphometric quantification of process length and the number of branch points, 7-dps (mean, ± SD error bars, n = 3). (J) Representative images of 2D reconstructions of astrocytes highlighting the amount of primary and secondary branches on each substrate 3-dps. Graphs of the number of intersections and intersections relative to the distance (graph of complexity) show the number of branches distributed along the astrocytes, 3-dps (mean, ± SEM error bars, n = 3). Red bar represents a peak of intersections at that distance from soma. (K) Representative images of 2D reconstructions of astrocytes highlighting the amount of primary and secondary branches on each substrate 7-dps. Graphs of the number of intersections and intersections relative to the distance (graph of complexity) show the number of branches distributed along the astrocytes, 7-dps (mean, ± SEM error bars, n = 3). Red bars represent peaks of intersections at that distance from soma. *Radius from soma represents 4 μm concentric grids centered on the cell soma. Statistical analysis was by one-way ANOVA with multiple comparisons of Tukey’s posthoc for parameters evaluation, and two-way ANOVA with multiple comparisons (using “intersections” as factor 1 and “distance” as factor 2) of Tukey’s posthoc for complexity graphs values with p < 0.05 were considered statistically significant. Scale bar 50 μm.

Similar articles

Cited by

References

    1. Centers for Disease Control and Prevention. Mortality data on CDC WONDER.; National Center for Health Statistics. https://wonder.cdc.gov/mcd.html (accessed 2022–08–17).
    1. Burda J. E.; Sofroniew M. V. Reactive Gliosis and the Multicellular Response to CNS Damage and Disease. Neuron 2014, 81 (2), 229.10.1016/j.neuron.2013.12.034. - DOI - PMC - PubMed
    1. Stichel C. C.; Müller H. W. The CNS Lesion Scar: New Vistas on an Old Regeneration Barrier. Cell Tissue Res. 1998, 294 (1), 1–9. 10.1007/s004410051151. - DOI - PubMed
    1. Wanner I. B.; Anderson M. A.; Song B.; Levine J.; Fernandez A.; Gray-Thompson Z.; Ao Y.; Sofroniew M. V. Glial Scar Borders Are Formed by Newly Proliferated, Elongated Astrocytes That Interact to Corral Inflammatory and Fibrotic Cells via STAT3-Dependent Mechanisms after Spinal Cord Injury. J. Neurosci. 2013, 33, 12870–12886. 10.1523/JNEUROSCI.2121-13.2013. - DOI - PMC - PubMed
    1. Gurtner G. C.; Werner S.; Barrandon Y.; Longaker M. T. Wound Repair and Regeneration. Nature 2008, 453 (7193), 314–321. 10.1038/nature07039. - DOI - PubMed