. 2024 Aug 21;112(16):2749-2764.e7.
doi: 10.1016/j.neuron.2024.05.019. Epub 2024 Jun 12.

A cerebellar granule cell-climbing fiber computation to learn to track long time intervals

Affiliations

A cerebellar granule cell-climbing fiber computation to learn to track long time intervals

Martha G Garcia-Garcia et al. Neuron. .

Abstract

In classical cerebellar learning, Purkinje cells (PkCs) associate climbing fiber (CF) error signals with predictive granule cells (GrCs) that were active just prior (∼150 ms). The cerebellum also contributes to behaviors characterized by longer timescales. To investigate how GrC-CF-PkC circuits might learn seconds-long predictions, we imaged simultaneous GrC-CF activity over days of forelimb operant conditioning for delayed water reward. As mice learned reward timing, numerous GrCs developed anticipatory activity ramping at different rates until reward delivery, followed by widespread time-locked CF spiking. Relearning longer delays further lengthened GrC activations. We computed CF-dependent GrC→PkC plasticity rules, demonstrating that reward-evoked CF spikes sufficed to grade many GrC synapses by anticipatory timing. We predicted and confirmed that PkCs could thereby continuously ramp across seconds-long intervals from movement to reward. Learning thus leads to new GrC temporal bases linking predictors to remote CF reward signals-a strategy well suited for learning to track the long intervals common in cognitive domains.

Keywords: associative learning; cerebellum; climbing fibers; granule cells; neural ramping; operant conditioning; reward learning; temporal encoding; temporal learning; two-photon imaging.


Conflict of interest statement

Declaration of interests The authors declare no competing interests.

Figures

Figure 1 |
Figure 1 |. Two-color, two-depth, two-photon Ca2+ imaging of cerebellar GrCs and CFs.
(A) Schematic of cerebellar microcircuit: ~100,000 GrCs and one CF innervate each PkC, with GrC→PkC synapses adjusted by CF-dependent plasticity. GrC “i” synapses on PkCs “j” and “j+1” with weights Wi j and Wi j+1. (B) Imaging schematic and histology. GrCs transgenically expressed GCaMP6f while PkCs virally expressed R-CaMP2. PkC dendritic Ca2+ reports complex spikes and thus CF activity. Through one objective, a 920 nm laser excited GCaMP in GrC somas while a remotely-focused 1064 nm laser excited PkC dendrites. (C) Mice grasped a robotic manipulandum and self-initiated 8-mm-maximum forward pushes of at least 6–7 mm for water reward following a delay (main GrC-CF data: 1.1 s; all other studies: 1-s or 2-s). 2-s after reward time, the handle automatically returned over the following 2-s. (D,E) Example in vivo mean two-photon simultaneous images of GrCs (D) and PkC dendrites (E). (F,G) Example extracted GrCs (F) and PkC dendrites (G). Detected spatial filters of active cells are superposed in pale yellow, or for 10 GrCs and PkC dendrites in colors corresponding to the traces in H,I. (H,I) For 10 GrCs (H) and PkC dendrites (I), color-matched to cells in (F) and (G), traces show time-varying fluorescence of each neuron. Stars show forelimb movements and rewards. PkC dendritic spiking hereafter referred to as CFs.
Figure 2 |
Figure 2 |. Mice learn to elevate licking near the time of expected reward, with cerebellar contributions
A, Lick rate before reward was higher on Day 7+ than Day 1 (334 Day 1 trials from 10 mice and 1,570 Day 7+ trials from 20 sessions in 12 mice; this and subsequent grey regions denote delay period and vertical lines denote movement and reward). Inset, p<10−6. B, Distribution of licks across delay (400/9, 919/16, 1,820/21, and 2,065/22 trials/sessions). C, Novice mice licked more early than late in the delay, whereas expert mice inverted this pattern ((late − early)/(late + early). Early: [−0.8, −0.6] s, late: [−0.2, 0] s. p<10−6). These and all subsequent centers denote means and shaded regions and error bars denote SEM across observations (see also Table S1). (D) Expert lick rate during rewarded and omitted reward trials (1,570 and 495 trials from 20 sessions in 12 mice). Inset, last time (max 2 s) at which lick rate exceeded 70% of the prior peak ([−0.25,0.5] s; p<10−6; 0 if licking never fell below 50% of peak). (E-H) Some mice trained with a 1-s delay followed by a 2-s delay (E). F, Licking on omitted reward trials for 1-s vs 2-s experts (283 1-s and 519 2-s trials from 14 mice, 16 sessions each). (G) 2-s expert omission licking was higher after 2-s than early in the delay, while 1-s experts showed the opposite pattern (p<10−6). (H) Omission licking peaked near respective expected reward times (p<10−6, peak over [0,3] s). (I-N) PCP2Cre/Ai32 PkC stimulation studies. (I,J) PCP2Cre/Ai32 mice with windows over right cerebellum LVI trained on the 1-s-delay task. Starting 0.2 s after mice pushed >7-mm, we activated ChR2 for 0.8 s on 20–40% of trials (I, Rewarded: 478 laser-off, 99 laser-on; J, omitted reward: 68 laser-off, 59 laser-on; 7 mice). Stimulation abolished anticipatory licking. Reward triggered recovery of normal licking, but on omission trials licking remained weaker and less well-timed (controls, Figure S2J–L). Pink: mean laser period. (K) Quantification of Figure 2I,J, S2J,K,L. “ΔLick rate”: each laser-on trial’s licking minus the mean laser-off licking, averaged from [0.35,0.8] s or [1.7,2.1] s from reward. Rewarded licking (Figure 2I) changed little in either window (p=0.8 and 0.06; difference p=0.1). Omission licking was reduced just after reward time (p=3×10⁻⁵ and <10−6 for long/Figure 2J and short/Figure S2J stim paradigms), but aberrantly elevated later (long stim: p=3×10⁻⁵; brief-stim, p=0.06; both paradigms late vs early p<10−6). Opsin-negative and LIX controls were not significant (bars p=0.2, 0.4, 0.3, 1; differences p=0.1, 0.7; laser-on omitted-reward trial counts: 99, 59, 85, 39, 34; mice/session counts: 7/9, 7/7, 3/3, 3/3). (L-N), PCP2-Ai32 mice that were experts on the 1-s delay retrained with 2-s delay, but with PkC stimulation on every rewarded trial from [1.6, 2.2] s from movement (90% of all trials, L). 10% of trials were laser-off reward-omission “probe” trials. Over 1 week of perturbed training—but evaluated on probe laser-OFF trials—mice never learned to lick near the 2-s reward delivery time (M, grayscale curves). During subsequent laser-OFF training, mice learned to lick near 2-s (M, green; 85, 79, 99, 59, and 261 reward omission trials per condition from 7 mice). N, Δlick rate during expected reward time minus early delay (recovery>laser-on p<10−6; laser-on across learning p=0.07).
Figure 3 |
Figure 3 |. Reward-anticipating GrC activity followed by reward-evoked CF spiking in expert mice
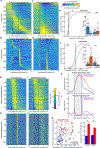
(A-D) Each row shows the fluorescence (GrCs, A and C) or spike rate (CFs, B and D) of a single neuron, aligned to reward delivery and averaged across expert rewarded trials (3,965 GrCs, 1,964 CFs, 34 sessions/20 mice). Cells sorted by time of peak activity (A,B) or magnitude of anticipatory (C) or reward-evoked activity (D). Red lines denote sorting quantification windows. (E,F) Activity quantifications either during delay (E) or post-reward (F), shown as histograms and (insets) binary statistical categories (p<0.05 and magnitude exceeding ±0.2 z-scores (“zsc”)). *p<10−6. ns, p=0.54. (G-J) Rasters of anticipatory GrCs (G,I) and reward-activated CFs (H,J) on rewarded (G,H) or omitted reward trials (I,J, 20% omissions). 762 GrCs spread across 33/34 expert sessions in 19/20 mice; >0.1 zsc comparing [0.3 –0.03] s to both [−1.3 −1] s and [+0.3 +0.5] s; 1094 CFs spread across all 34 expert sessions/20 mice; spike rate during [0 0.2] s >0.1 zsc, and >0.1 zsc higher than pre-reward [−0.3 −0.03] s). See also Figure S2N,O. (K,L) For neurons in (G-J), averages across trials and cells. Grey lines show times of first CF peaks following reward delivery and omission respectively. (M) Dots show mean across trials of GrC anticipatory off-time (x-axis, when fluorescence fell to <50% of peak over [-0.5 0] s), versus time of first population CF spiking (y-axis, when average rose above 20th percentile of the reward response [0 0.2] s). From sessions contributing to (G-J), 33/34 sessions, 19/20 mice, on trials with elevated CF reward spiking (117±6 trials per session). Inset, Average across sessions (p=1.6×10⁻⁶ for both, 33 sessions).
Figure 4 |
Figure 4 |. With behavioral learning, GrCs increasingly spanned the delay, while CFs persistently signaled reward
(A,B) Average across GrCs with elevated delay-period activity (A, [−0.3 −0.03] s > [−1.5 −1.3] s and > [0.3 0.5] s), on Day 1 vs Day 7+ sessions. B, Average across CFs with elevated reward spiking (from [0 0.2] s). Cell/session/mouse counts: A-Day-1: 752/15/15; A-Day-7+: 1,135/33/19; B-Day-1: 657/15/15; B-Day-7+: 1,462/34/20. (C,D) With learning, GrC anticipation increased in magnitude (C, p<10−6, 752/1135 Day1/7+ GrCs), and in prevalence (p=0.02, 33/15 Day1/7+ sessions). CF reward responses increased in magnitude modestly (D, p=4×10⁻⁴, 657/1462 Day1/7+ CFs), and remained equally prevalent (p=0.56, 15/34 Day1/7+ sessions). Significance proportions: thresholded magnitude differences from A,B at 0.2 zsc and single-cell p<0.05; total #cells: 839/1964 Day 1/7+ CFs; 2,334/3965 Day 1/7+ GrCs). Dots show sessions. (E) A cohort of mice trained for a week on the 1-s delay task, before switching to a 2-s delay for another week. (F-H) 1-s-to-2-s retraining GrC responses in 5 mice. GrCs in each image are sorted by center of timepoints with elevated activity during [0, 2] s, relative to pre-movement levels [−0.8, −0.3] s. Cell/sessions counts: 257/5, 263/5, 523/6. 2-s-novice data averaged over first 50 trials to highlight earliest exposures; 1-s-expert and 2-s-expert averages over random 50-trial subsets. Color-bar applies to all panels. (I,J) Duration of GrC elevated activity between [0,2] s, relative to premovement levels [−1,0] s was significantly higher in 2-s-experts (p<10−6; 257, 263, 523 GrCs respectively). (K) The proportion of GrCs with elevated activity for >1.6 s during [0,2] s rose with learning (p=0.02, dots show 5/5/6 sessions respectively). (L) Average activity of reward anticipation GrCs (criteria: activity higher in final 0.3s before reward compared to early in the delay [0.1, 0.4] s; n=89/257, 105/263, and 247/523 GrCs per learning phase). Dashed pink lines denote 1-s or 2-s reward. (M) Average activity of reward-responding CFs (rate [0,0.2] s >0.1 zsc higher than [−0.3, −0.03] ms. 17/61, 34/71, and 35/143 CFs per condition).
Figure 5 |
Figure 5 |. Learning yields GrC reward timing information that is computationally accessible to LTD
(A-C) Linear regression (A, least squares, 10-fold cross-validated) to decode time to reward via weighted sum of GrCs ([−1.1, 0] s). Example decoding performance Day 1 (B) and Day 7 (C) (41 trials, 127 and 111 cells). (D) GrC time decoding output averaged across all trials (1,047, 2,242, 4,355, and 4,708 trials from 20 mice). (E,F) GrC delay time decoding accuracy (E) averaged across sessions (p=1.4×10⁻⁵. Dots show 15, 25, 40 and 37 sessions). Accuracy post-reward (F, [1,2] s) was persistently low (p=0.1) and substantially poorer than anticipatory decoding in experts (p<10−6). See also Figure S4A–D. (G) CF-dependent GrC→PkC plasticity rule. When a PkC (“j”) receives a CF spike, GrC inputs active in the prior ~150 ms are weakened (LTD, top two GrCs), but other GrC inputs are not (bottom GrC). (H) Simulating LTD on CF-GrC data. Example CF and GrCs in three trials centered on reward and concatenated (black lines denote trial breaks). Orange dots denote CF spikes within [0, 250] ms of reward. Each GrC’s activity in green LTD window ([-150, 25] ms from CF spike) was tabulated as predicted LTD between that GrC and the CF-recipient PkC. A logistic function bounded each LTD event between [0,1] (11+eF/s; F=avgGrCsignalinLTDwindow; s=95th percentile fluorescence per cell, Methods). (I) Example session: GrC profiles sorted top to bottom by predicted LTD averaged over trials roughly ordered GrCs by time of peak activity during the delay (70 GrCs, 95 trials). Additional examples, Figure S4G–I. (J) For session in I, correlation between each GrC’s center of delay activity (x-axis, over [−1.1,0] s) vs its predicted LTD magnitude (y-axis; 70 GrCs, r=0.82, p<10−6, diagonal line, linear fit). Additional examples: Figure S4J–L. (K) Correlation from J across sessions grew with learning (magenta; p<10−6. Dots show 116 sessions; Days 7+ positive r at p<10−6, 37 expert sessions). LTD computed on time-shuffled GrC data had smaller correlations (p<10−6 37 expert sessions). See also Figure S4O. (L) GrCs grouped by predicted LTD magnitude (percentiles computed for each session; percentile bin edges: [0,20,40,50,60,70,80,90,95,100]). Traces: average activity per GrC group (normalized to [0,1] to highlight differences in timing). Cell counts from bottom to top: 2077, 2068, 1025, 1057, 1032, 1036, 1038, 517, 522; 76 day-4+ sessions. See Figure S4M,N. (M) Same as L, for 2-s-experts (bin edges: [0,30,50,65,80,90,95,100]; counts: 157,103,80,78,53,26,26; 6 sessions).
Figure 6 |
Figure 6 |. Simulated LTD-weighted GrC averages track time to reward for up to 2 seconds
(A-C) GrC readout using LTD predictions of GrC→PkC weights (A). Example Day-7 single-trial LTD-weighted GrC sums (B) or simple GrC average (C). Correlation: time vs weighted sums (40 trials shown of 68 total, 111 GrCs). Normalization: range of trial-average scaled to [1.1,0]. Additional examples, Figure S5A–C. (D) Correlation between time and LTD-weighted GrC sums rose with learning (p=1.6×10⁻⁵, dots show 116 sessions from 20 mice). Simple GrC average or randomly reordered LTD-weighted sums poorly correlated with time (weaker than LTD-weighted, p<10−6). (E) In experts, LTD-weighted GrCs were far closer to optimal time-decoding than random weights, simple averages, or LTD computed on time-shuffled GrCs (* p<10−6, dots show 37 sessions). (F) For 1-s-to-2-s retraining data, LTD-weighted GrC sums using CF reward spikes (i.e., either 1-s- or 2-s-post-movement). Trial counts: 250, 250, 299; Mice/sessions: 5/5, 5/5, 5/6. (G) LTD-weighted GrC sum timing accuracy (R2) over [0, 2] s for data in F (p<10−6, 799 trials). (H) Session-by-session behavioral performance (late [-0.2, 0] s minus early [−0.8, −0.6] s delay licking) versus LTD-weighted GrC sum timing accuracy. Spearman r=0.81, p<10−6, 62 sessions. Diagonal line, linear fit.
Figure 7 |
Figure 7 |. PkC simple spike ramps track interval from movement to expected reward for up to 2 s
(A-B) Neuropixels PkC recordings. A, Example expert PkC simple spike (SS) rate ramped downward during the delay (124 trials). B, Average z-scored SS rate of PkCs whose delay SS rate decreased below baseline (negative slope [−1 0] s and negative zsc [−150 −25] ms; 32%, 51/162 PkCs in 4 mice/16 Day-7+ sessions; positive ramping cells in Figure S7). (C-E) Alternatively, we imaged PkC two-photon somatic Ca2+ in the region of our GrC-CF recordings, (C, mean in vivo image). D, trial-averaged fluorescence for PkCs with negative slope from [0, 1] s for 1-s-expert data (65/4/2 total PkCs/sessions/mice) or [0, 2] s for 2-s-expert data (65/3/2 total PkCs/sessions/mice). Timing accuracy [0, 2] s was higher in 2-s-expert PkCs (E, p<10-6). (F) Schematic. Left: A canonical strategy using a “delay line” GrC basis: erroneous actions trigger CF spiking. GrCs sequentially activate at distinct times for short durations. Learning adjusts synapses of GrCs temporally coincident with CF signal, eliminating both future error and CF error signal. Right: Strategy to produce PkC delay-tracking ramps from action to reward. CFs signal reward. During learning, GrCs profiles lengthen to densely span the delay with varying kinetics. Pre-reward LTD window provides snapshot of GrC ramping kinetics (like Figure 5L,M). Using classical LTD, CF reward spiking grades many GrC→PkC synapses by GrC anticipatory timing. LTD-weighted GrCs yield PkC spiking ramps from predictor to reward. Thus, new GrC basis sets that emerge with learning enable new types of PkC computation.

Similar articles

Cited by

References

    1. Raymond JL, and Medina JF (2018). Computational Principles of Supervised Learning in the Cerebellum. Annu Rev Neurosci 41, 233–253. 10.1146/annurev-neuro-080317-061948. - DOI - PMC - PubMed
    1. Hull C (2020). Prediction signals in the cerebellum: Beyond supervised motor learning. eLife 9, e54073. 10.7554/eLife.54073. - DOI - PMC - PubMed
    1. Doya K (2000). Complementary roles of basal ganglia and cerebellum in learning and motor control. Current Opinion in Neurobiology 10, 732–739. 10.1016/S0959-4388(00)00153-7. - DOI - PubMed
    1. Sokolov AA, Miall RC, and Ivry RB (2017). The Cerebellum: Adaptive Prediction for Movement and Cognition. Trends Cogn Sci 21, 313–332. 10.1016/j.tics.2017.02.005. - DOI - PMC - PubMed
    1. Ivry RB, and Keele SW (1989). Timing functions of the cerebellum. J Cogn Neurosci 1, 136–152. 10.1162/jocn.1989.1.2.136. - DOI - PubMed

LinkOut - more resources