. 2024 Oct:159:155942.
doi: 10.1016/j.metabol.2024.155942. Epub 2024 Jun 12.

The mitochondrial TSPO ligand Atriol mitigates metabolic-associated steatohepatitis by downregulating CXCL1

Affiliations

The mitochondrial TSPO ligand Atriol mitigates metabolic-associated steatohepatitis by downregulating CXCL1

Yuchang Li et al. Metabolism. 2024 Oct.

Abstract

Background and aims: The mitochondrial translocator protein (TSPO, 18 kDa) is pivotal in binding cholesterol and facilitating its transfer from the outer to the inner mitochondrial membrane. Atriol is a TSPO ligand disrupting cholesterol binding by targeting the cholesterol-recognition amino acid consensus domain. Prior research has shown that TSPO deficiency improved metabolic-associated steatohepatitis (MASH). We hypothesized that Atriol may have the potential to alleviate MASH.

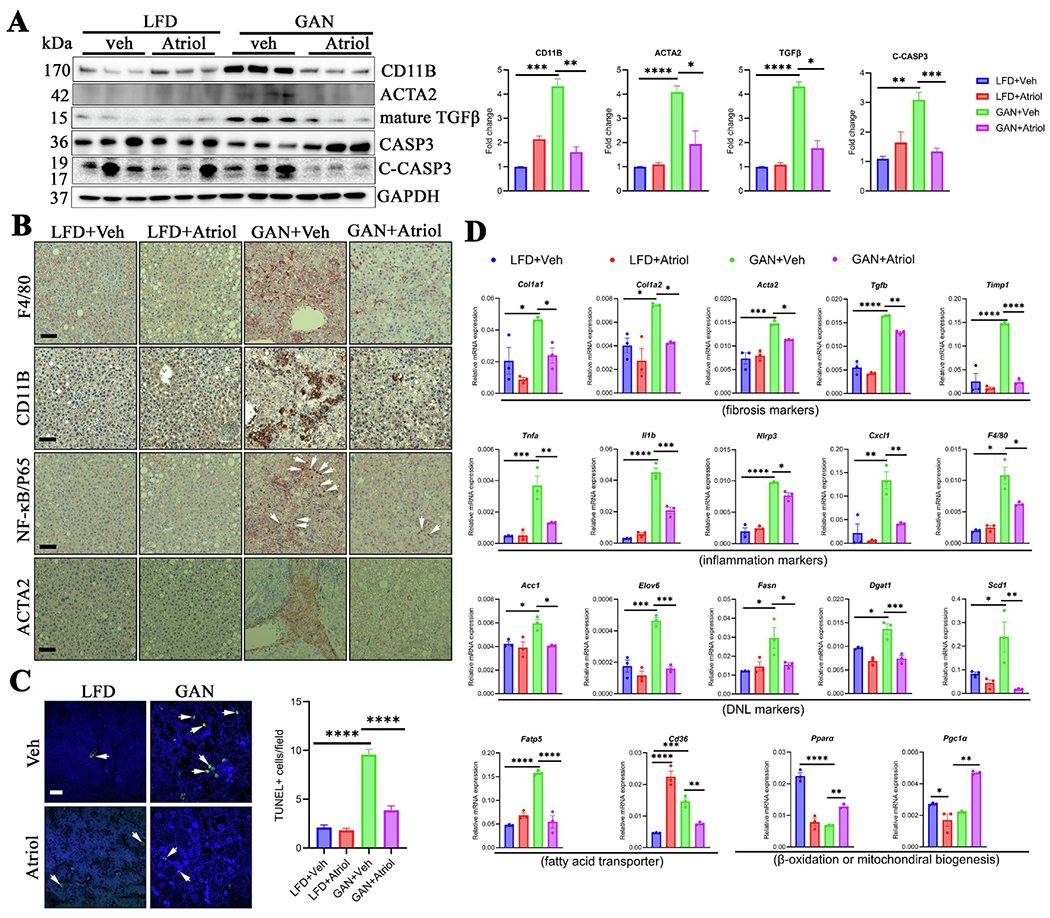
Methods and results: In vitro cell culture studies revealed that Atriol treatment effectively mitigated MASH by restoring mitochondrial function, inhibiting the NF-κB signaling pathway, and reducing hepatic stellate cell (HSC) activation. SD male rats were fed a GAN diet for 10 months to induce MASH. During the final two weeks of feeding, rats received intraperitoneal Atriol administration daily. Atriol treatment significantly ameliorated MASH by reducing lipid accumulation, diminishing hepatic lobular inflammation and fibrosis, decreasing cell death, and inhibiting excessive bile acid synthesis. Moreover, Atriol restored mitochondrial function in primary hepatocytes isolated from MASH rats. In search of the mechanism(s) governing these effects, we found that Atriol downregulated the proinflammatory chemokine CXCL1 through the NF-κB signaling pathway or via myeloperoxidase (MPO) in HSCs and Kupffer cells. Additionally, in vitro, studies further suggested that CXCL1 treatment induced dysfunctional mitochondria, inflammation, HSCs activation, and macrophage migration, whereas Atriol countered these effects. Finally, the mitigating effects of Atriol on MASH were reproduced by pharmacological inhibition of NF-κB or MPO and neutralization of CXCL1.

Conclusion: Atriol ameliorates MASH both in vitro and in vivo, demonstrating its potential therapeutic benefits in managing MASH.

Keywords: ADME (Absorption, Distribution, Metabolism, Excretion); Crown-like structures; Fibrosis; Mitochondrial function; Myeloperoxidase; Pharmacokinetic profile; Proinflammation.


Conflict of interest statement

Declaration of competing interest Go Sugahara is an employee of PhoenixBio, Co., Ltd., Higashi-Hiroshima, Hiroshima, Japan.

Figures

Fig.1.
Fig.1.. TSPO-ligand Atriol reverses the MASH phenotype in vitro.
(A) TSPO ligand 3, 17,19-androsten-5-trio (Atriol) chemical structure. (B) Cellular thermal shift assay (CETSA) of Atriol binding TSPO in Huh-7 cells. Huh7 was treated with either DMSO (Veh) or Atriol (100μM). Illustration of the thermal aggregation curves with TSPO densitometry values normalized in immunoblots at various temperatures verse Veh at 37°C. (C) Immunocytochemistry staining and quantification of nuclear NF-κB P65 in Huh-7 cells or PMA induced macrophages from THP-1 after treatment with DMSO (Veh) and different doses of Atriol (0μM, 10μM, 50μM,100 μM). White arrows indicated nuclear NF-κB P65. P65 nuclear cell numbers were quantified using Image J. Scale, 20μm. (D) Seahorse analysis of cellular oxygen consumption rate (OCR) of basal respiration, maximum respiration, and ATP production in humanized liver chimeric mouse–derived human hepatocytes (HLCM-HH) treated with Veh, LPS (100 mg/mL) and oleic acid (OA) (400 μM), or LPS+OA+Atriol (100 uM). (E) Immunoblots of ACTA2, COL1A1, and GAPDH in LX-2 cells treated with Veh, TGFβ (1ng/ml), OCA (100nM), TGFβ+OCA, Atriol (100μM), or TGFβ+Atriol. (F) Representative confocal images of COL1A1 (red) in LX-2 cells treated with Veh, TGFβ (1ng/ml), Atriol (100μM), or TGFβ+Atriol. Scale, 10μm. Data are expressed as mean ± SEM, *p < 0.05, **p < 0.01, ***p < 0.001, ****p < 0.0001 by one-way ANOVA with Turkey’s correction .
Fig. 2.
Fig. 2.. Atriol ameliorates damage to liver structure in MASH.
(A) Schematic design of GAN diet-fed MASH rat model. During the final two weeks (week 41-43), Veh or Atriol (20mg/kg bw) was administered daily by intraperitoneal injection. PND, postnatal day. (B) Representative images of the anatomy and livers stained with H&E, Oil Red O (ORO), or Sirius Red (SR) in LFD+Veh, LFD+Atriol, GAN+Veh, and GAN+Atriol groups. Scale, 100μm. (C) Liver weight/body weight ratio; ALT; AST; plasma cholesterol, insulin, non-esterified fatty acid (NEFA), and TAG; and hepatic TAG content in LFD+Veh, LFD+Atriol, GAN+Veh, and GAN+Atriol groups. (D) H&E and F4/80 or Adiponectin immunofluorescent staining in white adipose tissue (WAT) in LFD+Veh, LFD+Atriol, GAN+Veh, and GAN+Atriol groups. The white arrow indicates the thick membrane of the adipocytes; red arrowheads indicate crown-like adipocytes (CLA) in H&E staining slides. The red arrow indicates F4/80 positive crown-like structures, and the arrowhead indicates Adiponectin positive signals. Scale, 20μm. Data are expressed as mean ± SEM, *p < 0.05, **p < 0.01, ***p < 0.001, ****p < 0.0001 by one-way ANOVA with Turkey’s correction.
Fig. 3.
Fig. 3.. Atriol reduces liver inflammation, fibrosis, cell death, de novo lipogenesis, and fatty acid transporter markers, while enhancing mitochondrial function indicators in MASH.
(A) Immunoblots were performed to assess the expression levels of CD11B, ACTA2, TGFβ, and cleaved caspase 3 (C-CASP3) in liver tissues in LFD+Veh, LFD+Atriol, GAN+Veh, and GAN+Atriol groups. The fold change (FC) of CD11B, ACTA2, and TGFβ densities was calculated relative to the LFD+Veh group after normalization with GAPDH. The ratio of C-CASP3 to total caspase 3 (CASP3) was determined. (B) Immunohistochemistry staining of F4/80, CD11B, NF-κB, and ACTA2 in liver tissues in LFD+Veh, LFD+Atriol, GAN+Veh, and GAN+Atriol groups. The white arrow indicates nuclear P65. Scale, 20βm. (C) Confocal imaging and quantification of TUNEL+ cells after immunofluorescent staining of livers in LFD+Veh, LFD+Atriol, GAN+Veh, and GAN+Atriol groups. White arrows indicate TUNEL positive cells. Scale, 10βm. (D) qPCR of fibrosis markers (Col1a1, Col1a2, Acta2, Tgfβ, and Timp1), inflammation markers (Tnfα, Il1β, Nlrp3, Cxcl1, and F4/80), de novo lipogenesis (DNL) markers (Acc1, Elov6, Fasn, Dgat1, Scd1), fatty acid transporters (Fabp5, Cd36), and β-oxidation or mitochondrial biogenesis markers (Pparα, Pgc1α) in LFD+Veh, LFD+Atriol, GAN+Veh, and GAN+Atriol groups. All experiments were repeated at least 3 times. Data are expressed as mean ± SEM, *p < 0.05, **p < 0.01, ***p < 0.001, ****p < 0.0001 by one-way ANOVA with Turkey’s correction.
Fig. 4.
Fig. 4.. Atriol maintains bile acid homeostasis and restores mitochondrial function without increasing ROS production in MASH in vivo.
(A) Immunoblot of FXR, PPARα, CPT1A, and OXPHOS components in the livers in LFD+Veh, LFD+Atriol, GAN+Veh, and GAN+Atriol groups. (B) Bile acid composition analysis in serum in LFD+Veh, LFD+Atriol, GAN+Veh, and GAN+Atriol groups. GCA, glycocholic acid; GCDCA, glycochenodeoxycholic acid; GDCA, glycodeoxycholic acid; TDCA, taurodeoxycholic acid. (C) Seahorse analysis of cellular oxygen consumption rate (OCR) of basal respiration, maximum respiration, and ATP production in Huh7 cells treated with Veh, GCA (200μm), GCDCA (200μm), GDCA (50μm), or TDCA (10μm) with or without Atriol. (D) Seahorse analysis of basal respiration, maximum respiration, and ATP production in primary hepatocytes isolated from GAN+Veh, and GAN+Atriol rats. (E) Immunoblot of CV-ATP5A, CIII-UQCRC2, FXR, PGC1α, PPARα, and TGFβ in the primary hepatocytes from LFD+Veh, LFD+Atriol, GAN+Veh, and GAN+Atriol groups. (F) Representative images of immunofluorescence staining of 4-hydroxy-2-nonenal (HNE) and malondialdehyde (MDA) in liver in LFD+Veh, LFD+Atriol, GAN+Veh, and GAN+Atriol groups. White arrow (top panels) indicates HNE signal and white arrowhead (bottom panels) indicates MDA signal. Scale, 20μm. All experiments were repeated at least 3 times. Data are expressed as mean ± SEM, *p < 0.05, **p < 0.01, ***p < 0.001, ****p < 0.0001 by one-way ANOVA with Turkey’s correction in (B-C) and student’s t-test (D).
Fig. 5.
Fig. 5.. CXCL1 is downregulated by Atriol treatment in MASH.
(A) Plasma cytokine profiles and quantification in LFD+Veh, LFD+Atriol, GAN+Veh, and GAN+Atriol groups (n=3 pooled). (B) Immunoblot analysis of CXCL1, myeloperoxidase (MPO) from liver extracts in LFD+Veh, LFD+Atriol, GAN+Veh, and GAN+Atriol groups. (C) Representative images of immunofluorescence staining of CXCL1 and MPO in liver in LFD+Veh, LFD+Atriol, GAN+Veh, and GAN+Atriol groups. The white arrow (top panels) and white arrowhead (bottom panels) indicate CXCL1 and MPO positive cells, respectively. Scale, 20μm. (D) qPCR of CXCL1 in Huh-7, LX-2, and PMA induced macrophages from THP-1 cells after treatment with Veh, human recombinant MPO (1ng/ul), MPO+4-aminobenzoic acid hydrazide (4-ABAH) (200μM), or MPO+Taurine (50μM). (E) Representative confocal images of CXCL1 (green) and COL1A1 (red) in LX-2 cells, or CXCL1 (red) and F4/80 (green) in PMA induced macrophages from THP-1 cells after treatment with Veh, MPO, MPO+ABAH or MPO+Taurine. Scale, 10μm. (F) qPCR analysis of MPO expression in LX2 treated with human recombinant TGFβ with or without Atriol. (G) ELISA analysis of CXCL1 in the cultured medium from LX-2 cell (left) or in PMA induced macrophages from THP-1 cells (right) after treatment with Veh, recombinant MPO (1ng/ul), or MPO+ABAH (200mM). (H) Colocalization analysis of CXCL1 (red) and Desmin (DES, green) (white arrows), or CXCL1 (red) and F4/80 (green) (white arrowhead) in rat livers in GAN+Veh and GAN+ABAH. Scale, 20μm. (I) Immunoblot analysis and immunofluorescent staining of ACTA2. White arrow indicates ACTA2 signal (green). Scale, 20μm. Data are expressed as mean ± SEM, *p < 0.05, **p < 0.01, ***p < 0.001, ****p < 0.0001 by one-way ANOVA with Turkey’s correction in (B, D, F) and student’s t-test (H).
Fig. 6.
Fig. 6.. CXCL1 impairs mitochondrial function, activates HSCs, induces inflammation, and promotes macrophage infiltration, whereas Atriol counters these effects.
(A) H&E staining of livers from normal, SS, or MASH patients, black arrow indicates infiltration inflammation. Scale,100μm. CXCL1 colocalization with ASGR1, CD68, or DESMIN (DES) in liver; white arrow indicates colocation. Scale, 100μm. (B) Seahorse analysis in HLCM-HH treated with Veh, CXCL1 (100 ng/mL), or CXCL1+ Atriol (100uM). (C) Immunoblot analysis of ACTA2 and COL1A1 in human LX-2 cells or rat BSC treated with Veh, CXCL1, or CXCL1+Atriol. (D) Representative confocal images of immunofluorescence staining of COL1A1 in LX-2 cells or BSC treated with Veh, CXCL1, or CXCL1+ Atriol. Scale, 10μm. (E) Immunoblot and quantification of TNFα in THP-1-derived macrophages treated with Veh, CXCL1, or CXCL1+Atriol. (F) Representative confocal images after immunofluorescence staining of TNFα in THP-1-derived macrophages treated with Veh, CXCL1, or CXCL1+ Atriol; the red color indicates TNFα positive signals. Scale, 10μm. (G) Co-culture of Huh-7 cells in lower chamber treated with Veh, CXCL1, or CXCL1+ Atriol, and THP-1-derived macrophages in upper chamber. Migrated cells in the upper chamber were stained and quantified. Scale, 100μm. Data are expressed as mean ± SEM, *p < 0.05, **p < 0.01, ***p < 0.001, ****p < 0.0001 by one-way ANOVA with Turkey’s correction in.
Fig. 7.
Fig. 7.. Pharmacological inhibition of NF-κB/CXCL1 axis or neutralizing CXCL1 effectively reproduces the mitigating effects of Atriol on MASH.
(A) Immunoblot analysis of TNFα, CXCL1, and ACTA2 from liver extracts in GAN+Veh and GAN+CEL (Celastrol). (B) Immunohistochemistry staining of NF-κB (black arrow indicates nuclear NF-κB), F4/80 (white arrow), and immunofluorescence staining of CD11B (white arrow), ACTA2 (white arrow) in the livers in GAN+Veh and GAN+CEL. Scale, 20μm. (C) Immunoblot analysis of NF-κB p65 from nuclear and cytoplasmic fractions from primary hepatocytes isolated from GAN+Veh and GAN+CEL rats (n=3). (D) Immunoblot of TNFα, IL1β, ACTA2, FXR, and PPARα in rat liver extracts in LFD, GAN+Veh, and GAN+CXCL1 neu. (E) Immunohistochemistry staining of ACTA2, F4/80 (white arrow), or NF-κB p65 (red arrowhead indicates nuclear localization) in livers in LFD, GAN+Veh, and GAN+CXCL1 neu. Scale, 20μm. (F) TBARS levels in rat liver tissues from LFD, GAN+Veh, and GAN+CXCL1 neu groups. Data are expressed as mean ± SEM, *p < 0.05, **p < 0.01, ***p < 0.001, ****p < 0.0001 by one-way ANOVA with Turkey’s correction in (F) and student’s t-test (A, C).

References

    1. Younossi Z, Stepanova M, Ong JP, Jacobson IM, Bugianesi E, Duseja A, Eguchi Y, Wong VW, Negro F, Yilmaz Y, et al. (2019). Nonalcoholic steatohepatitis is the fastest growing cause of hepatocellular carcinoma in liver transplant candidates. Clin Gastroenterol Hepatol 17, 748–755 e743. 10.1016/j.cgh.2018.05.057. - DOI - PubMed
    1. Ibrahim SH, Hirsova P, and Gores GJ (2018). Non-alcoholic steatohepatitis pathogenesis: sublethal hepatocyte injury as a driver of liver inflammation. Gut 67, 963–972. 10.1136/gutjnl-2017-315691. - DOI - PMC - PubMed
    1. Harrison SA, Bedossa P, Guy CD, Schattenberg JM, Loomba R, Taub R, Labriola D, Moussa SE, Neff GW, Rinella ME, et al. (2024). A Phase 3, Randomized, Controlled Trial of Resmetirom in NASH with Liver Fibrosis. N Engl J Med 390, 497–509. 10.1056/NEJMoa2309000. - DOI - PubMed
    1. Friedman SL, Neuschwander-Tetri BA, Rinella M, and Sanyal AJ (2018). Mechanisms of NAFLD development and therapeutic strategies. Nat Med 24, 908–922. 10.1038/s41591-018-0104-9. - DOI - PMC - PubMed
    1. Parlati L, Regnier M, Guillou H, and Postic C (2021). New targets for NAFLD. JHEP Rep 3, 100346. 10.1016/j.jhepr.2021.100346. - DOI - PMC - PubMed

MeSH terms

LinkOut - more resources