. 2024 Jun 13;15(1):5053.
doi: 10.1038/s41467-024-49292-z.

Genomic characterization of cervical lymph node metastases in papillary thyroid carcinoma following the Chornobyl accident

Affiliations

Genomic characterization of cervical lymph node metastases in papillary thyroid carcinoma following the Chornobyl accident

Lindsay M Morton et al. Nat Commun. .

Abstract

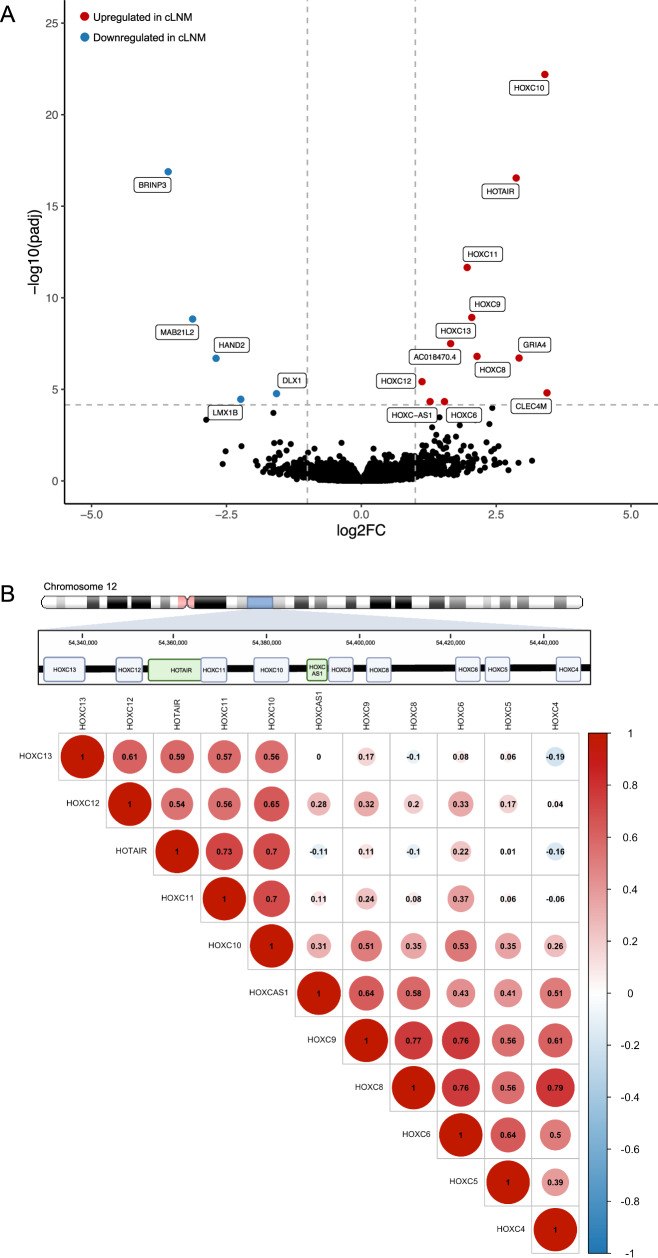
Childhood radioactive iodine exposure from the Chornobyl accident increased papillary thyroid carcinoma (PTC) risk. While cervical lymph node metastases (cLNM) are well-recognized in pediatric PTC, the PTC metastatic process and potential radiation association are poorly understood. Here, we analyze cLNM occurrence among 428 PTC with genomic landscape analyses and known drivers (131I-exposed = 349, unexposed = 79; mean age = 27.9 years). We show that cLNM are more frequent in PTC with fusion (55%) versus mutation (30%) drivers, although the proportion varies by specific driver gene (RET-fusion = 71%, BRAF-mutation = 38%, RAS-mutation = 5%). cLNM frequency is not associated with other characteristics, including radiation dose. cLNM molecular profiling (N = 47) demonstrates 100% driver concordance with matched primary PTCs and highly concordant mutational spectra. Transcriptome analysis reveals 17 differentially expressed genes, particularly in the HOXC cluster and BRINP3; the strongest differentially expressed microRNA also is near HOXC10. Our findings underscore the critical role of driver alterations and provide promising candidates for elucidating the biological underpinnings of PTC cLNM.


Conflict of interest statement

E.T.D. is an employee of Nvidia Corporation and owns stock in Nvidia, Illumina, and Pacific Biosciences. G.G. receives research funds from IBM and Pharmacyclics, and is an inventor on patent applications related to MuTect, ABSOLUTE, MutSig, MSMuTect, MSMutSig, MSIdetect, POLYSOLVER, and TensorQTL. G.G. is a founder, consultant and holds privately held equity in Scorpion Therapeutics. The remaining authors declare no competing interests.

Figures

Fig. 1
Fig. 1. Distribution of cLNM at diagnosis among 428 PTC tumors in our primary study population with a final designated driver, by driver type and gene.
Red = cLNM, Blue = no cLNM. Percentages >20% are shown. Pheterogeneity represents a two-sided P value calculated using likelihood ratio tests, comparing model fit with and without the variable of interest. Source data are provided as follows: Table S3 provides all counts and percentages, including information on the other mutations and fusions.
Fig. 2
Fig. 2. Comparison of genomic characteristics between 47 cLNM and paired PT samples.
Data include patient and sample characteristics, PTC driver, mutation, structural variant, and somatic copy number alteration counts. Source data are provided as follows: Table S9 provides all counts.
Fig. 3
Fig. 3. Burden of simple somatic variants (SSVs) by sample type.
Distribution of SNVs (A), small deletions (B), and small insertions (C) in cLNM and PT samples. Red = cLNM, Blue = paired primary tumors, Light blue = matched primary tumors. All box plots include the center line at the median, the box denotes the interquartile range (IQR), whiskers denote the rest of the data distribution, and outliers are denoted by points greater than ±1.5 × IQR. Note that the Y-axis scales differ among panels. Source data are provided as follows: Table S9 provides counts. Figure S5 provides scatter plots of the distributions in paired cLNM-PT samples.
Fig. 4
Fig. 4. Results of transcriptomic analyses.
Differentially expressed genes between cLNM and PT samples (A) and correlation among gene expression levels within the HOXC locus (created with BioRender.com) (B). Two-sided P values were calculated using simple linear regression models on the normalized read counts to determine whether tissue status (cLNM vs. PT) was associated with differential gene and mRNA expression, adjusted for sample batch, sex, and age at PTC. Adjusted p values were calculated using the standard Benjamini–Hochberg false discovery rate (FDR) method. Source data are provided as follows: Supplementary Data 4 provides the full results.
Fig. 5
Fig. 5. Top differentially expressed genes.
Expression levels of HOXC10 (A), HOTAIR (B), and BRINP3 (C) in each sample type. Red = cLNM, Shades of blue = primary tumors, Shades of gray = non-tumor thyroid tissue. All box plots include the center line at the median, the box denotes the interquartile range (IQR), whiskers denote the rest of the data distribution, and outliers are denoted by points greater than ±1.5 × IQR. Source data are provided as follows: Supplementary Data 4 provides the full results.
Fig. 6
Fig. 6. Results of miRNA analyses.
Differentially expressed miRNAs between cLNM and PT samples. Two-sided P values were calculated using simple linear regression models on the normalized read counts to determine whether tissue status (cLNM vs. PT) was associated with differential gene and miRNA expression, adjusted for sample batch, sex, and age at PTC. Adjusted p values were calculated using the standard Benjamini–Hochberg false discovery rate (FDR) method. Source data are provided as follows: Supplementary Data 6 provides the full results.
Fig. 7
Fig. 7. Top differentially expressed miRNAs.
Expression levels of miR-196a2 (A), miR-615 (B), miR-137 (C), and miR-141 (D) in each sample type. Red = cLNM, blue = paired primary tumors, light blue = matched primary tumors. All box plots include the center line at the median, the box denotes the interquartile range (IQR), whiskers denote the rest of the data distribution, and outliers are denoted by points greater than ±1.5 × IQR. Source data are provided as follows: Supplementary Data 6 provides the full results.

References

    1. Miller KD, et al. Cancer statistics for adolescents and young adults, 2020. CA Cancer J. Clin. 2020;70:443–459. doi: 10.3322/caac.21637. - DOI - PubMed
    1. Howlader, N. et al. SEER cancer statistics review, 1975-2018. National Cancer Institute. https://seer.cancer.gov/csr/1975_2018/ (2021).
    1. Lim H, Devesa SS, Sosa JA, Check D, Kitahara CM. Trends in thyroid cancer incidence and mortality in the United States, 1974-2013. JAMA. 2017;317:1338–1348. doi: 10.1001/jama.2017.2719. - DOI - PMC - PubMed
    1. Haugen BR, et al. 2015 American Thyroid Association Management Guidelines for adult patients with thyroid nodules and differentiated thyroid cancer: The American Thyroid Association Guidelines Task Force on thyroid nodules and differentiated thyroid cancer. Thyroid. 2016;26:1–133. doi: 10.1089/thy.2015.0020. - DOI - PMC - PubMed
    1. Mao J, et al. Risk factors for lymph node metastasis in papillary thyroid carcinoma: a systematic review and meta-analysis. Front. Endocrinol. 2020;11:265. doi: 10.3389/fendo.2020.00265. - DOI - PMC - PubMed

MeSH terms