. 2024 Jun 13;15(1):5025.
doi: 10.1038/s41467-024-49117-z.

Potential pandemic risk of circulating swine H1N2 influenza viruses

Affiliations

Potential pandemic risk of circulating swine H1N2 influenza viruses

Valerie Le Sage et al. Nat Commun. .

Abstract

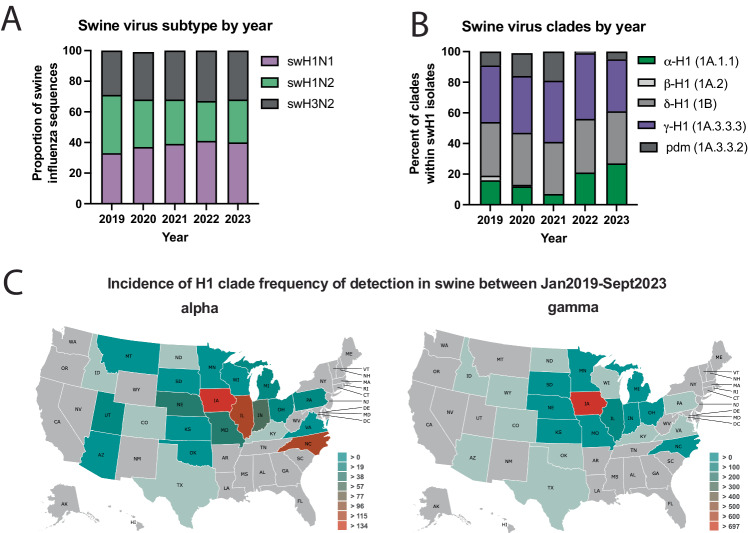
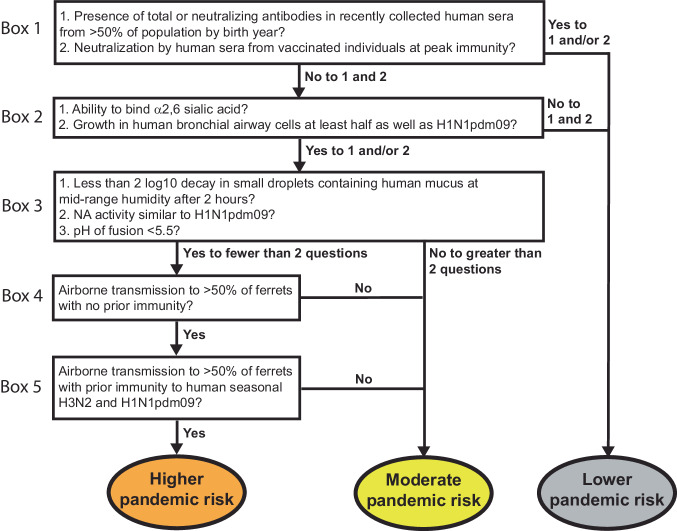
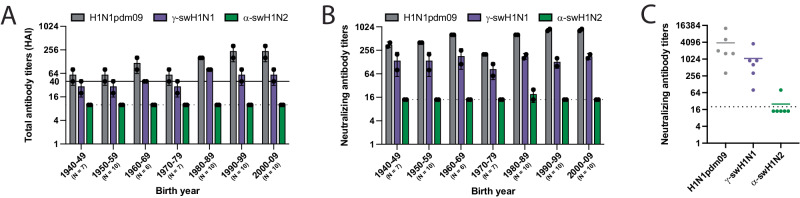
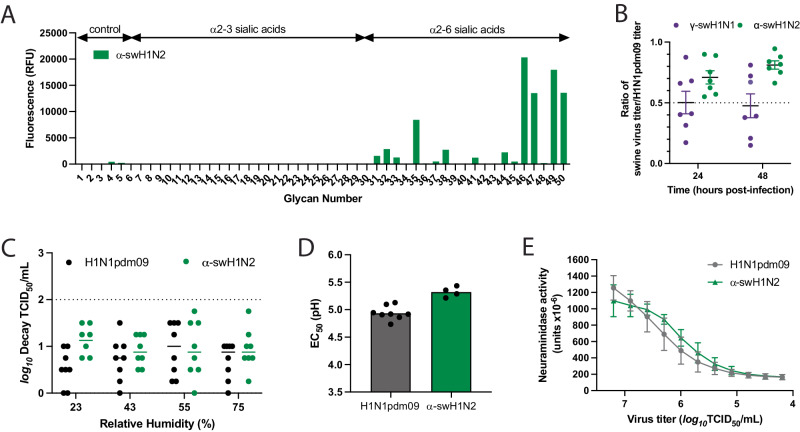
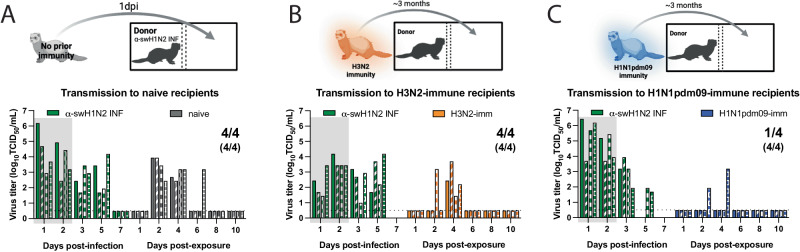
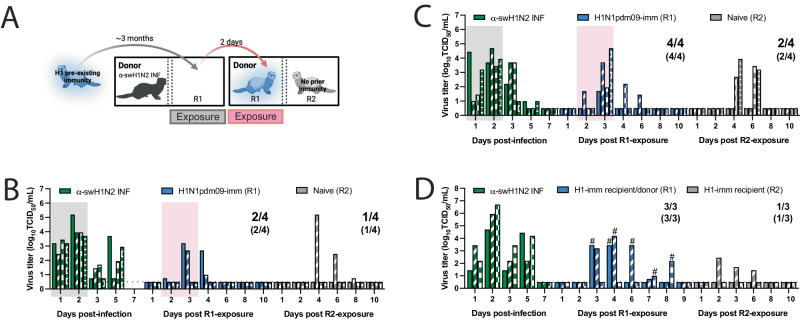
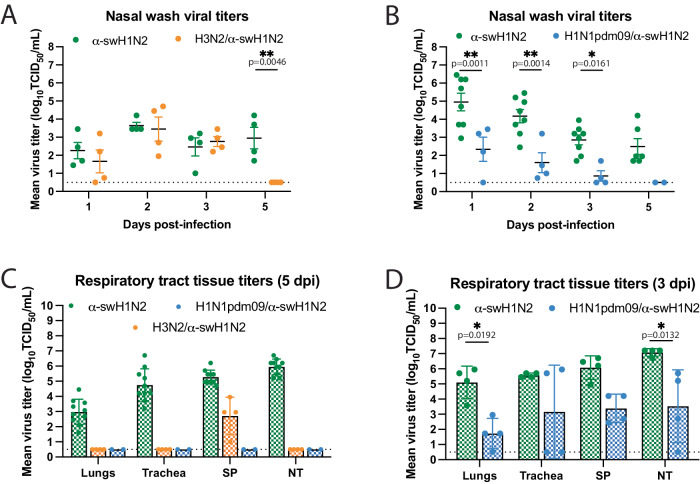
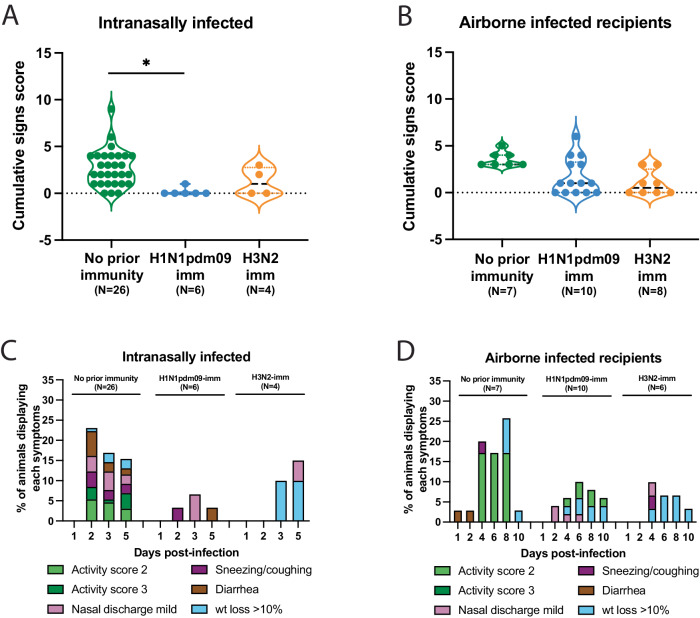
Influenza A viruses in swine have considerable genetic diversity and continue to pose a pandemic threat to humans due to a potential lack of population level immunity. Here we describe a pipeline to characterize and triage influenza viruses for their pandemic risk and examine the pandemic potential of two widespread swine origin viruses. Our analysis reveals that a panel of human sera collected from healthy adults in 2020 has no cross-reactive neutralizing antibodies against a α-H1 clade strain (α-swH1N2) but do against a γ-H1 clade strain. The α-swH1N2 virus replicates efficiently in human airway cultures and exhibits phenotypic signatures similar to the human H1N1 pandemic strain from 2009 (H1N1pdm09). Furthermore, α-swH1N2 is capable of efficient airborne transmission to both naïve ferrets and ferrets with prior seasonal influenza immunity. Ferrets with H1N1pdm09 pre-existing immunity show reduced α-swH1N2 viral shedding and less severe disease signs. Despite this, H1N1pdm09-immune ferrets that became infected via the air can still onward transmit α-swH1N2 with an efficiency of 50%. These results indicate that this α-swH1N2 strain has a higher pandemic potential, but a moderate level of impact since there is reduced replication fitness and pathology in animals with prior immunity.


Conflict of interest statement

The authors declare no competing interests.

Figures

Fig. 1
Fig. 1. Influenza A virus detected in swine between January 2019 and September 2023 in the USA.
A Influenza A virus subtype detection proportions. B H1 influenza A virus hemagglutinin clade detection proportions. pdm; pandemic. Data for A and B obtained from octoFLUshow. C Detections of α-swH1N2 (alpha) and γ-swH1N1 (gamma) influenza A virus in swine across the United States between 2019 and 2021. Data retrieved with permission from ISU FLUture on September 30, 2023.
Fig. 2
Fig. 2. Decision tree of influenza virus pandemic threat assessment.
Boxes include in vitro and in vivo methods to characterize influenza virus strains. Yes/no questions allow triage of strains into different pandemic risk assessment categories.
Fig. 3
Fig. 3. Cross-reactivity of human sera to swine γ-H1N1 and α-H1N2 influenza viruses.
Pooled sera from the indicated number of humans for each decade of birth were tested for antibodies to H1N1pdm09 (red bars), γ-swH1N1 (purple bars), and α-swH1N2 (green bars) by HAI (A) and neutralization (B) assay. Data are presented as mean values +/− standard deviation (SD) from two biological replicates. Solid line in A indicates an HAI titer of 40, which corresponds to a 50% reduction in the risk of influenza virus infection. C Sera from individuals (N = 6) vaccinated in October 2021 (14 to 21 days post-vaccination) were assessed for cross-reactive neutralizing antibodies. Each dot represents an individual sample and is an average of 2 technical replicates. The colored lines represent the mean values between all the individual biological samples. For AC, dashed lines indicate the limit of detection for each assay.
Fig. 4
Fig. 4. In vitro characterization of swine γ-H1N1 and α-H1N2 influenza viruses.
A Binding of α-swH1N2 virus to a sialoside microarray containing glycans with α2-3 or α2-6 linked sialic acids representing avian-type and human-type influenza receptors, respectively. Bars represent the fluorescence intensity of bound α-swH1N2. Glycan structures corresponding to numbers are shown on the x-axis are found in Supplementary Table 1. Signal values are calculated from the mean intensities of 4 of 6 replicate spots with the highest and lowest signal omitted. B Replication of swine influenza virus in human bronchial epithelial (HBE) air-liquid interface cell cultures. HBE cell cultures were infected in triplicate with 103 TCID50 (tissue culture infectious dose 50) per well of H1N1pdm09, γ-swH1N1, or α-swH1N2. The apical supernatant was collected at the indicated time points and virus titers were determined on MDCK cells using TCID50 assays. A ratio of swine virus titer relative to H1N1pdm09 titer at 24 and 48 h of all HBE patient cell cultures is shown. Each dot represents an average of three technical replicates per HBE culture, and seven biological replicates from different HBE patient cultures are displayed. Data are presented as mean values +/− SD of the seven biological replicates each with three technical replicates. C Stability of α-swH1N2 influenza virus in small droplets over a range of relative humidity (RH) conditions. Ten 1 uL droplets of pooled virus from panel B were spotted into the wells of a tissue culture dish for 2 h. Decay of the virus at each RH was calculated compared to the titer of ten 1 uL droplets deposited and immediately recovered from a tissue culture dish. Log10 decay of HBE-propagated H1N1pdm09 (black) and α-swH1N2 (green) is shown and represents mean values (±SD) from eight biological replicates performed in three technical replicates. D H1N1pdm09 (gray, N = 8) and α-swH1N2 (green, N = 4) viruses were incubated in PBS solutions of different pHs for 1 h at 37 °C. Virus titers were determined by TCID50 assay and the EC50 values were plotted using regression analysis of the dose-response curve. The reported mean corresponds to at least four independent biological replicates, each performed in three technical replicates. E The NA activities of H1N1pdm09 (gray) and α-swH1N2 (green) were determined using an enzyme-linked lectin assay with fetuin as the substrate. Viruses were normalized for equal infectivity and displayed data are the mean (±SD) of three independent biological replicates performed in technical duplicates.
Fig. 5
Fig. 5. Swine α-H1N2 transmits efficiently via the air after a short exposure.
A Schematic of experimental procedure to naïve recipients. Shaded gray box depicts exposure period. Four donor ferrets were infected intranasally with α-swH1N2 (α-swH1N2 INF), as in Methods. Recipient ferrets with no prior immunity (naïve recipients) were placed in the adjacent cages at 24 h post-infection for two continuous days. B Schematic of procedure, whereby four ferrets were infected with H3N2 A/Perth/16/2009 strain (H3N2-imm) 137 days prior to acting as recipients to α-swH1N2 infected donors. Four donor ferrets were infected with α-swH1N2 and H3N2-imm recipients were placed in the adjacent cage 24 h later. C Schematic of procedure, whereby four ferrets were infected with H1N1pdm09 (H1N1pdm09-imm) 126 days prior to acting as recipients to α-swH1N2 infected donors. H1N1pdm09-imm recipients were placed in the adjacent cage 24 h later. Nasal washes were collected from all ferrets on the indicated days and titered for virus by TCID50 (tissue culture infectious dose 50). Each bar indicates an individual ferret. Pairs of ferrets are matched with the shading type within the bar. For all graphs, the number of recipient ferrets with detectable virus in nasal secretions out of four total is shown; the number of recipient animals that seroconverted at 14- or 21-days post α-swH1N2 exposure out of four total is shown in parentheses. Gray shaded box indicates shedding of the donor during the exposure period. The limit of detection is indicated by the dashed line. Schematics in AC were created with BioRender.com.
Fig. 6
Fig. 6. Swine H1N2 virus transmission chain.
A Schematic of transmission chain experiment in B and C (image created with BioRender.com). Four ferrets were infected with H1N1pdm09 (R1) 127 days before being exposed to a donor that was infected with α-swH1N2 24 h prior. After a 2-day exposure, H1N1pdm09-imm recipients were transferred to a new transmission cage to act as the donors. The transfer of each R1 animal was done without knowledge of its infection status. A naïve recipient (R2) was immediately placed in the adjacent cage and exposed for 2 days. The transmission chain experiment was performed two independent times. Nasal secretions were collected for all animals on the indicated days post-infection or post-exposure, with each bar representing the virus titer shed by an individual animal for replicate 1 (B) and replicate 2 (C). Pairs of ferrets can be matched based on the patterns in the bars. Gray shaded boxes indicate the days upon which the α-swH1N2 infected (α-swH1N2 INF) donor was exposing the H1N1pdm09-imm recipient (R1), and the pink shaded box indicates the days upon which R1 was acting as the donor to R2. Limit of detection is denoted by a dashed line. The numbers in parentheses indicate the proportion of animals that seroconverted. D Donors were infected with α-swH1N2 24 h prior to exposing H1N1pdm09-imm recipients. Nasal washes from R1 recipients were collected and immediately tested using a rapid antigen test. Once positive for influenza virus antigen, the H1N1pdm09-imm R1 recipient was moved into a new transmission cage to act as the donor and expose an H1N1pdm09-imm R2 recipient for 2 days. # indicates the 2-day window in which each of the R1 ferret exposed the R2 recipients.
Fig. 7
Fig. 7. H1N1pdm09-immune ferrets have reduced α-swH1N2 viral titers in nasal secretions and tissues.
A Ferrets with no pre-existing immunity (α-swH1N2, N = 4) or those infected with H3N2 137 days prior (H3N2/α-swH1N2, N = 4) were intranasally infected with α-swH1N2. The mean ± SD viral titers from nasal secretions are shown with each circle representing an individual animal. Two-way ANOVA analysis was used to determine statistically significant differences. B α-swH1N2 mean ± SD viral titers from nasal secretions from animals with no prior immunity (α-swH1N2, N = 8) or those infected with H1N1pdm09 126 days prior (H1N1pdm09/α-swH1N2, N = 4). Two-way ANOVA analysis was used to determine statistically significant differences. C Respiratory tissues from α-swH1N2 infected ferrets with no prior immunity (green; N = 10), H3N2 prior immunity (orange; N = 4), or H1N1pdm09 prior immunity (blue; N = 2) were collected at 5 dpi. Graphs show the mean hatched bar ± SD of viral titers for all biological replicates presented as individual data points. SP-soft palate, NT-nasal turbinates. (D) Respiratory tissues from α-swH1N2 infected ferrets with no prior immunity (green; N = 4) or H1N1pdm09 prior immunity (blue; N = 4) were collected at 3 dpi. Graphs show the mean hatched bar ± SD of viral titers for all biological replicates presented as individual data points. Two-way ANOVA analysis was used to determine statistically significant differences. The dashed line indicates the limit of detection for all graphs.
Fig. 8
Fig. 8. Pre-existing H1N1pdm09 immunity reduces swine α-H1N2 influenza virus clinical signs.
A The symptoms for each intranasally α-swH1N2-infected ferret from Figs. 5 and 6 having either no prior immunity (N = 22), H1N1pdm09-imm (N = 6) or H3N2-imm (N = 4) were added together to assign each animal a cumulative score. Each dot represents the cumulative symptoms score for a single ferret. Two-way ANOVA analysis was used to determine statistically significant differences (*p = 0.0452). B The symptoms for each airborne α-swH1N2-infected ferret from Figs. 5 and 6 having either no prior immunity (N = 7), H1N1pdm09-imm (N = 10) or H3N2-imm (N = 4) were added together to assign each animal a cumulative score. Each dot represents the cumulative symptoms score for a single ferret. C Percent number of intranasally infected ferrets from panel A displaying each symptom on the indicated days post-infection. D Percent number of recipient ferrets from B displaying each symptom on the indicated days post-exposure. For C and D, wt = weight.

References

    1. Webster RG, Bean WJ, Gorman OT, Chambers TM, Kawaoka Y. Evolution and ecology of influenza A viruses. Microbiol. Rev. 1992;56:152–179. doi: 10.1128/mr.56.1.152-179.1992. - DOI - PMC - PubMed
    1. Mena I, et al. Origins of the 2009 H1N1 influenza pandemic in swine in Mexico. Elife. 2016;5:e16777. doi: 10.7554/eLife.16777. - DOI - PMC - PubMed
    1. Smith GJ, et al. Origins and evolutionary genomics of the 2009 swine-origin H1N1 influenza A epidemic. Nature. 2009;459:1122–1125. doi: 10.1038/nature08182. - DOI - PubMed
    1. Arendsee ZW, et al. octoFLUshow: an Interactive Tool Describing Spatial and Temporal Trends in the Genetic Diversity of Influenza A Virus in U.S. Swine. Microbiol. Resour. Announc. 2021;10:e0108121. doi: 10.1128/MRA.01081-21. - DOI - PMC - PubMed
    1. Anderson TK, et al. A phylogeny-based global nomenclature system and automated annotation tool for H1 hemagglutinin genes from swine influenza A viruses. mSphere. 2016;1:e00275–16. doi: 10.1128/mSphere.00275-16. - DOI - PMC - PubMed

MeSH terms