. 2024 Jun 13;15(1):5042.
doi: 10.1038/s41467-024-49336-4.

Histone serotonylation in dorsal raphe nucleus contributes to stress- and antidepressant-mediated gene expression and behavior

Affiliations

Histone serotonylation in dorsal raphe nucleus contributes to stress- and antidepressant-mediated gene expression and behavior

Amni Al-Kachak et al. Nat Commun. .

Abstract

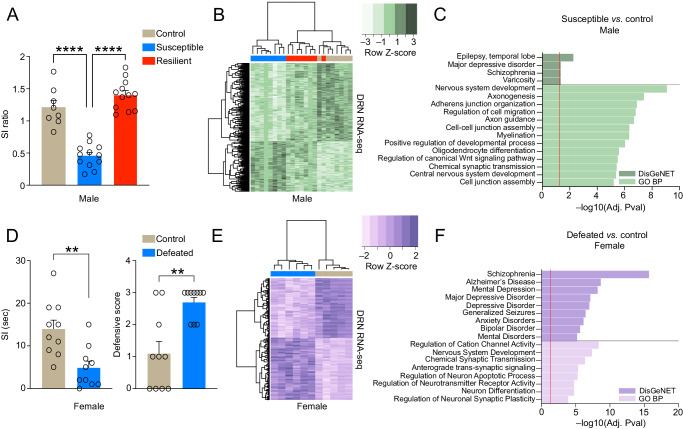
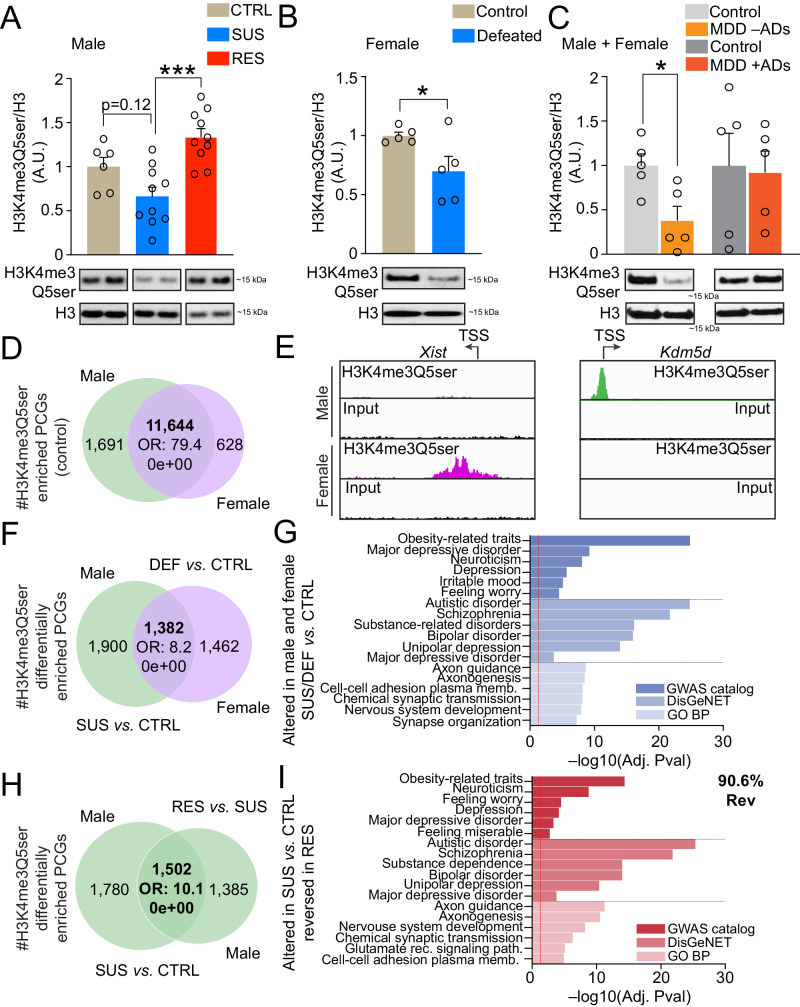
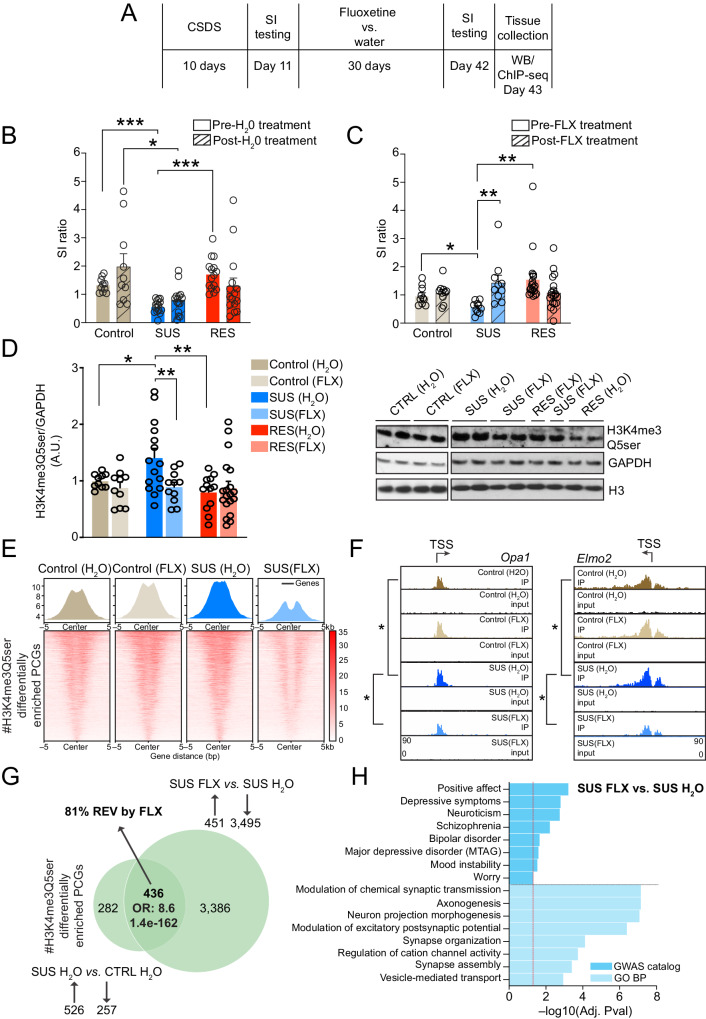
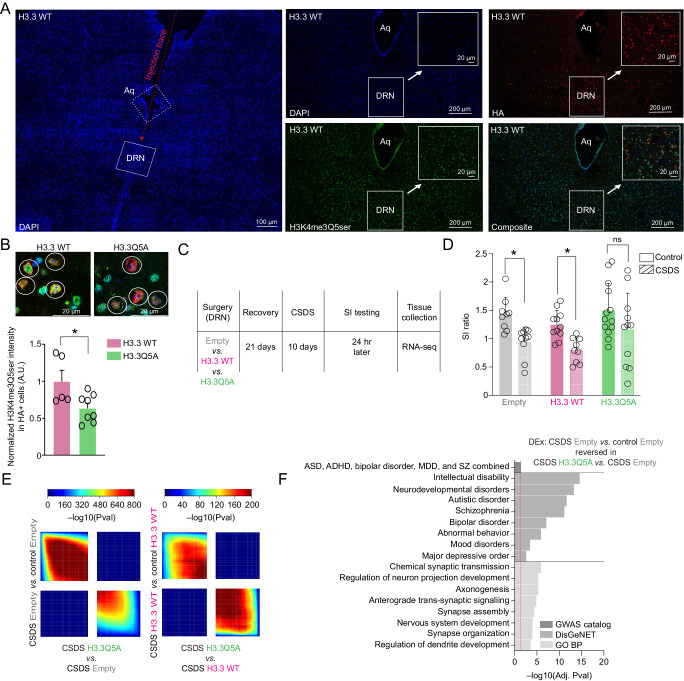
Mood disorders are an enigmatic class of debilitating illnesses that affect millions of individuals worldwide. While chronic stress clearly increases incidence levels of mood disorders, including major depressive disorder (MDD), stress-mediated disruptions in brain function that precipitate these illnesses remain largely elusive. Serotonin-associated antidepressants (ADs) remain the first line of therapy for many with depressive symptoms, yet low remission rates and delays between treatment and symptomatic alleviation have prompted skepticism regarding direct roles for serotonin in the precipitation and treatment of affective disorders. Our group recently demonstrated that serotonin epigenetically modifies histone proteins (H3K4me3Q5ser) to regulate transcriptional permissiveness in brain. However, this non-canonical phenomenon has not yet been explored following stress and/or AD exposures. Here, we employed a combination of genome-wide and biochemical analyses in dorsal raphe nucleus (DRN) of male and female mice exposed to chronic social defeat stress, as well as in DRN of human MDD patients, to examine the impact of stress exposures/MDD diagnosis on H3K4me3Q5ser dynamics, as well as associations between the mark and depression-related gene expression. We additionally assessed stress-induced/MDD-associated regulation of H3K4me3Q5ser following AD exposures, and employed viral-mediated gene therapy in mice to reduce H3K4me3Q5ser levels in DRN and examine its impact on stress-associated gene expression and behavior. We found that H3K4me3Q5ser plays important roles in stress-mediated transcriptional plasticity. Chronically stressed mice displayed dysregulated H3K4me3Q5ser dynamics in DRN, with both AD- and viral-mediated disruption of these dynamics proving sufficient to attenuate stress-mediated gene expression and behavior. Corresponding patterns of H3K4me3Q5ser regulation were observed in MDD subjects on vs. off ADs at their time of death. These findings thus establish a neurotransmission-independent role for serotonin in stress-/AD-associated transcriptional and behavioral plasticity, observations of which may be of clinical relevance to human MDD and its treatment.


Conflict of interest statement

The authors declare no competing interests.

Figures

Fig. 1
Fig. 1. Chronic social stress in both male and female mice results in altered gene expression in DRN.
A SI ratio of control vs. stress-susceptible vs. stress-resilient male mice (n = 8 for controls, 12 for susceptible and 12 for resilient groups). One-way ANOVA significant main effects observed (p < 0.0001, F2,29 = 53.44). Tukey’s MC test: control vs. susceptible mice (p < 0.0001) and susceptible vs. resilient mice (p < 0.0001). B Clustering of control, susceptible and resilient groups for 1502 differentially expressed (DE) genes (susceptible vs. control; n = 7–8/group, FDR < 0.05). C Pathway enrichment (FDR < 0.05; Benjamini–Hochberg) for the PCGs differentially expressed (FDR < 0.1) in susceptible vs. control males. Dashed line indicates significance via adjusted p value. DLeft SI time of control vs. socially defeated female mice (n = 10/group). Student’s two-tailed t tests: defeated vs. control mice (p = 0.0021, t18 = 3.582). DRight Defensive scores for control vs. socially defeated female mice. Mann-Whitney test (unpaired): defeated vs. control mice (p = 0.0034, U = 14.50). E Clustering of defeated and control groups for 234 DE genes (defeat vs. control; n = 5–6/group, FDR < 0.05). F Pathway enrichment (FDR < 0.05; Benjamini–Hochberg) for PCGs differentially expressed in defeat vs. control females (at FDR < 0.1). Dashed line indicates significance via adjusted p value. For bar graphs, data presented as mean ± SEM. Source data are provided as a Source Data file.
Fig. 2
Fig. 2. Chronic social stress promotes altered H3 serotonylation dynamics in DRN.
A H3K4me3Q5ser in DRN of control (n = 6) vs. stress-susceptible (n = 10) vs. stress-resilient male mice (n = 10). One-way ANOVA significant main effects observed (p = 0.0002, F2,23 = 12.43). Tukey’s MC test: susceptible vs. resilient mice (p = 0.0001). B H3K4me3Q5ser in DRN of control vs. defeated female mice (n = 5/group). Student’s two-tailed t test: defeated vs. control mice (p = 0.0473, t8 = 2.341). C H3K4me3Q5ser in DRN from human postmortem brain of MDD individuals ± antidepressants onboard at time of death vs. respective controls (n = 5/group). Student’s two-tailed t tests (individual MDD groups vs. matched controls): MDD –AD’s vs. controls (p = 0.0166, t8 = 3.020). For western blotting graphs, *p < 0.05, ***p < 0.001. A.U., arbitrary units, normalized to controls; total histone H3 levels were used as loading controls. D Overlap between H3K4me3Q5ser enriched PCGs (FDR < 0.05; Fisher’s exact test) in control male vs. female DRN (n = 3/group, 3–4 samples pooled per n). Odds ratio (OR) and respective p value of overlap are provided. E IGV tracks for two sex-specific loci displaying sex-specific enrichment of permissive H3K4me3Q5ser vs. respective inputs. F Overlap between male vs. female PCGs displaying differential enrichment for H3K4me3Q5ser in DRN as a consequence of CSDS [male susceptible vs. control, and female defeated vs. control; n = 3/group, 3–4 samples pooled per n, FDR < 0.05 (Fisher’s exact test)]. OR and respective p value of overlap is provided. G Pathway enrichment for PCGs displaying overlapping (male vs. female; 1382 PCGs) differential enrichment for H3K4me3Q5ser as a consequence of CSDS (FDR < 0.05; Benjamini–Hochberg). H Overlap between male susceptible vs. control and male resilient vs. susceptible PCGs displaying altered H3K4me3Q5ser enrichment in DRN [n = 3/group, 3–4 samples pooled per n, FDR < 0.05 (Fisher’s exact test)]. OR and respective p value of overlap are provided. I Pathway enrichment for PCGs displaying overlapping and reversed differential enrichment for H3K4me3Q5ser in male susceptible vs. control and male resilient vs. susceptible comparisons (FDR < 0.05; Benjamini–Hochberg). See Supplementary Fig. 7A–C for uncropped blots. Data presented as mean ± SEM. Source data are provided as a Source Data file.
Fig. 3
Fig. 3. Chronic fluoxetine treatments rescue behavioral deficits and stress-induced H3K4me3Q5ser dynamics in DRN in stress-susceptible male mice.
A Timeline: fluoxetine vs. water experiments. B SI ratio: control (n = 10), stress-susceptible (n = 15) and stress-resilient (n = 15), pre- vs. post-30 days water. Two-way RM ANOVA: stress (p = 0.0005, F2,37 = 9.298) and stress x time (p = 0.0234, F2,37 = 4.162). Posthoc t tests with Bonferroni correction: control vs. susceptible, pre-treatment (p = 0.0003); susceptible vs. resilient, pre-treatment (p = 0.0003); and control vs. susceptible, post-treatment (p = 0.0201). C SI ratio: control (n = 10), susceptible (n = 10) and resilient (n = 19), pre- vs. post-30 days fluoxetine. Two-way RM ANOVA: stress x treatment (p = 0.0018, F2,36 = 7.548). Bonferroni’s MC tests: susceptible mice, pre- vs. post-30 days fluoxetine (p = 0.0098). Posthoc t tests with Bonferroni correction: control vs. susceptible, pre-treatment (p = 0.0111), and susceptible vs. resilient, pre-treatment (p = 0.0066). D H3K4me3Q5ser in DRN: control (n = 10 for water and FLX), susceptible (n = 15 water; n = 11 FLX) and resilient (n = 12 water; n = 19 FLX) following 30 days of fluoxetine vs. water. Two-way ANOVA: stress (p = 0.0289, F2,71 = 3.725) and stress x fluoxetine (p = 0.0420, F2,71 = 3.316). Sidak’s MC tests: susceptible post-30 days fluoxetine vs. susceptible post-30 days water (p = 0.0094); Tukey’s MC: susceptible vs. control, post-30 days water (p = 0.0554), and susceptible vs. resilient, post-30 days water (p = 0.0013). GAPDH and H3 levels were used as loading controls. E H3K4me3Q5ser enrichment at PCGs displaying differential enrichment (FDR < 0.05) between SUS FLX vs. SUS H2O for each group. F IGV tracks for two genes displaying significantly (*diffReps) increased enrichment for H3K4me3Q5ser in SUS (H2O) vs. control (H2O), and rescue in SUS (FLX) vs. SUS (H2O). G Overlap between PCGs displaying protracted differential enrichment of H3K4me3Q5ser by CSDS vs. PCGs displaying regulation of the mark by fluoxetine in susceptible mice [n = 3/group, 3–4 samples pooled per n, FDR < 0.05 (Fisher’s exact test)]. OR and respective p values of overlap are provided. H Pathway enrichment for PCGs displaying differential enrichment for H3K4me3Q5ser in susceptible FLX vs. susceptible H2O (FDR < 0.05; Benjamini–Hochberg). *p < 0.05, **p < 0.01, ***p < 0.001. Data presented as mean ± SEM. A.U. arbitrary units; normalized to controls. Supplementary Fig. 7D: uncropped blots. Source data are provided as a Source Data file.
Fig. 4
Fig. 4. Viral-mediated downregulation of H3 serotonylation in DRN promotes stress resilience and attenuates stress-induced gene expression.
A IHC/IF images of mouse DRN virally transduced to express HA-tagged H3.3 WT—Far left panel: tiled ×40 image of DRN-containing slice with nuclear co-stain DAPI (4′,6-diamidino-2-phenylindole) showing an example injection trace to target mouse DRN; Middle and far right panels: tiled ×40 images of DRN-containing slice stained for DAPI, HA and H3K4me3Q5ser demonstrating targeted and nuclear expression of H3.3 WT. B Immunofluorescence-based quantification of H3K4me3Q5ser levels/intensity in DRN tissues transduced (HA+) with either H3.3WT (n = 6 slices) or H3.3Q5A (n = 7 slices) (slices analyzed from 3 animals/virus—see Supplementary Fig. 8 for slices used in quantifications). Student’s two-tailed t test revealed a significant difference between H3.3Q5A vs. H3.3 WT transduced mice (p = 0.0444, t11 = 2.269); representative zoomed in ×40 images of quantified DRN cells are provided (co-stained for DAPI, HA and H3K4me3Q5ser). C Experimental timeline for male CSDS after intra-DRN viral transduction by empty vector, H3.3 WT or H3.3Q5A vectors, followed by behavioral testing and tissue collections for RNA-seq. D SI ratios of GFP (n = 9 control; n = 10 CSDS), H3.3 WT (n = 11 control; n = 9 CSDS) and H3.3Q5A (n = 13 control; n = 11 CSDS) transduced mice, control vs. CSDS. Two-way ANOVA significant main effects of stress observed (p = 0.0001, F1,57 = 17.29). Bonferroni’s MC tests within viral group revealed significant differences between control vs. CSDS groups in GFP (p = 0.0310) and H3.3 WT mice (p = 0.0474), with no differences observed between control vs. CSDS H3.3Q5A mice. E Threshold-free RRHO analyses comparing transcriptional profiles for stress-regulated genes in empty vector and H3.3 WT-transduced DRN (control vs. CSDS) to H3.3Q5A-transduced DRN from CSDS mice (n = 4–9/group). Each pixel represents the overlap between differential transcriptomes, with the significance of overlap of a hypergeometric test color-coded. F Pathway enrichment for PCGs displaying differentially expressed genes in CSDS empty vs. control empty comparisons and rescue in CSDS H3.3Q5A vs. CSDS Empty comparisons (FDR < 0.1). Select enriched pathways are shown (FDR < 0.05; Benjamini–Hochberg). For all bar graphs, data presented as mean ± SEM. Source data are provided as a Source Data file.

Update of

Similar articles

Cited by

References

    1. Warnick SJ, Jr., Mehdi L, Kowalkowski J. Wait-there’s evidence for that? Integrative medicine treatments for major depressive disorder. Int. J. Psychiatry Med. 2021;56:334–343. doi: 10.1177/00912174211046353. - DOI - PubMed
    1. Duman RS, Aghajanian GK, Sanacora G, Krystal JH. Synaptic plasticity and depression: new insights from stress and rapid-acting antidepressants. Nat. Med. 2016;22:238–249. doi: 10.1038/nm.4050. - DOI - PMC - PubMed
    1. Mendlewicz J. Towards achieving remission in the treatment of depression. Dialogues Clin. Neurosci. 2008;10:371–375. doi: 10.31887/DCNS.2008.10.4/jmendlewicz. - DOI - PMC - PubMed
    1. Blier P, El Mansari M. Serotonin and beyond: therapeutics for major depression. Philos. Trans. R. Soc. Lond. B Biol. Sci. 2013;368:20120536. doi: 10.1098/rstb.2012.0536. - DOI - PMC - PubMed
    1. Moncrieff J, et al. The serotonin theory of depression: a systematic umbrella review of the evidence. Mol. Psychiatry. 2023;28:3243–3256. doi: 10.1038/s41380-022-01661-0. - DOI - PMC - PubMed

MeSH terms