. 2024 Jun 13;13(1):22.
doi: 10.1038/s41389-024-00521-6.

Comprehensive multi-omics analysis of breast cancer reveals distinct long-term prognostic subtypes

Collaborators, Affiliations

Comprehensive multi-omics analysis of breast cancer reveals distinct long-term prognostic subtypes

Abhibhav Sharma et al. Oncogenesis. .

Abstract

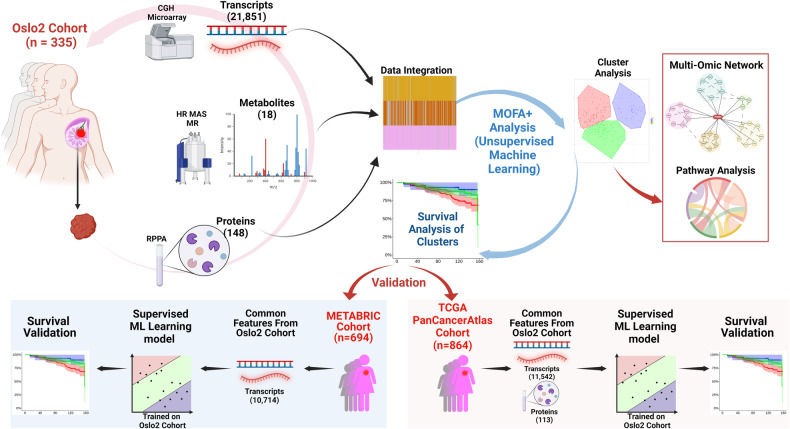
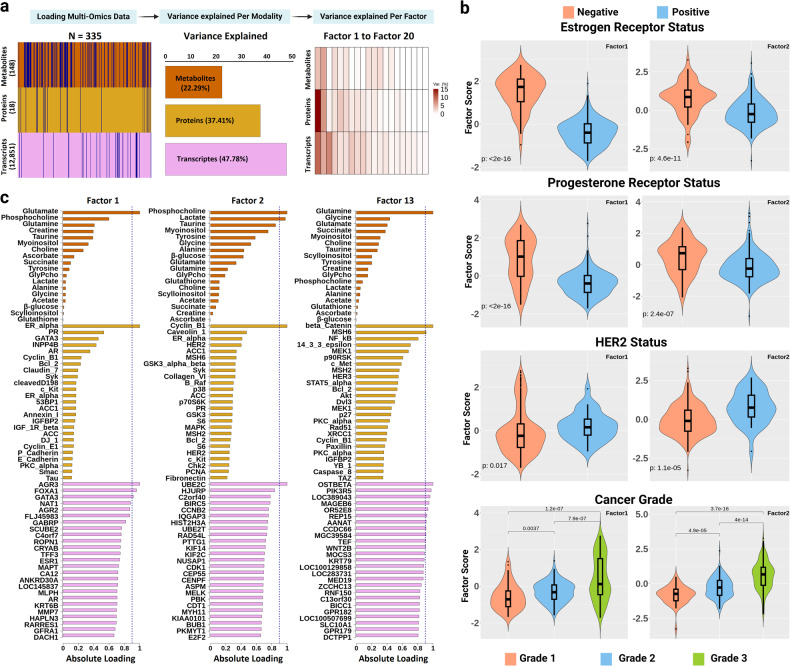
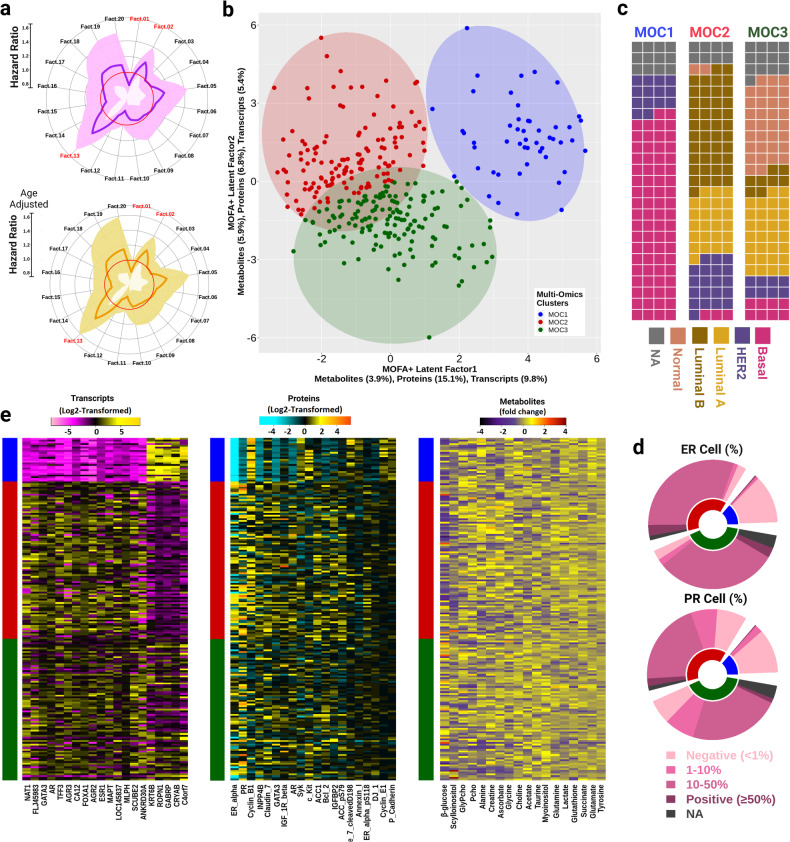
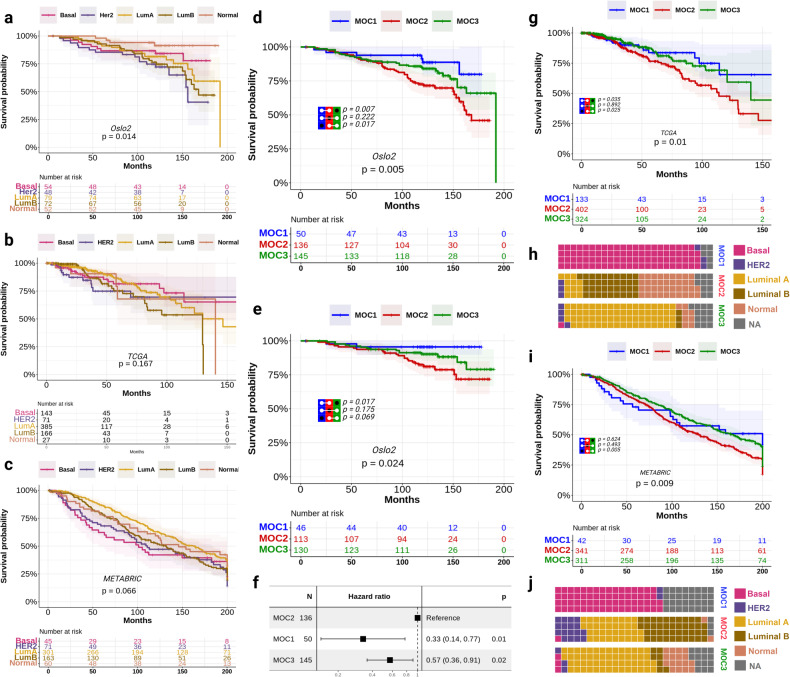
Breast cancer (BC) is a leading cause of cancer-related death worldwide. The diverse nature and heterogeneous biology of BC pose challenges for survival prediction, as patients with similar diagnoses often respond differently to treatment. Clinically relevant BC intrinsic subtypes have been established through gene expression profiling and are implemented in the clinic. While these intrinsic subtypes show a significant association with clinical outcomes, their long-term survival prediction beyond 5 years often deviates from expected clinical outcomes. This study aimed to identify naturally occurring long-term prognostic subgroups of BC based on an integrated multi-omics analysis. This study incorporates a clinical cohort of 335 untreated BC patients from the Oslo2 study with long-term follow-up (>12 years). Multi-Omics Factor Analysis (MOFA+) was employed to integrate transcriptomic, proteomic, and metabolomic data obtained from the tumor tissues. Our analysis revealed three prominent multi-omics clusters of BC patients with significantly different long-term prognoses (p = 0.005). The multi-omics clusters were validated in two independent large cohorts, METABRIC and TCGA. Importantly, a lack of prognostic association to long-term follow-up above 12 years in the previously established intrinsic subtypes was shown for these cohorts. Through a systems-biology approach, we identified varying enrichment levels of cell-cycle and immune-related pathways among the prognostic clusters. Integrated multi-omics analysis of BC revealed three distinct clusters with unique clinical and biological characteristics. Notably, these multi-omics clusters displayed robust associations with long-term survival, outperforming the established intrinsic subtypes.


Conflict of interest statement

The authors declare no competing interests.

Figures

Fig. 1
Fig. 1. A graphical overview of the study framework.
Transcriptomic, metabolomic and proteomic profiles were obtained from BC tissue samples of 335 patients within the Oslo2 cohort [21]. These multi-omics modalities were analyzed through an integrative unsupervised machine learning approach, Multi-Omics Factor Analysis (MOFA+), followed by a clustering analysis identifying three multi-omics clusters. The formation of clusters was based on the survival-associated latent factors identified by the MOFA+ model. A system biology approach was performed to further characterize these newly identified clusters. Finally, the multi-omics clusters were validated in large publicly available cohorts -TCGA (PanCancer Atlas) and METABRIC- using a supervised machine learning framework.
Fig. 2
Fig. 2. MOFA+ analysis of the Oslo2 cohort.
a This illustration depicts the chronological steps involved in MOFA+ analysis. Once the multiple modality dataset is loaded, the MOFA model compresses the multi-omics data into 20 latent factors. This process also assesses the contribution of each modality and its corresponding factors in explaining variance. Multi-omics dataset layers and the summary is illustrated (left) followed by the total variance explained per modality (middle), and the proportion of variance explained by individual factors (right). The dark blue lines in the left plot indicate missing values. b The violin plots show the distribution of ER, PR, HER2 status and cancer grade for multi-omic factors 1 and 2. The p values are reported from two-sample Wilcoxon rank sum tests. In all panels, the center line of the boxplot represents the median, while the bounds of the box represent the interquartile range (IQR). c The absolute loadings of features in factor 1, factor 2 and factor 13 are displayed. The list includes all 18 metabolites, while only the top 25 most significant features from the proteome and transcriptome layers are shown. All absolute loadings for the latent factors are provided in Supplementary Data 2. The blue dotted vertical line represents the threshold for highly important targets (>0.9) within each modality. GlyPcho Glycerophosphocholine.
Fig. 3
Fig. 3. Molecular characterization of the multi-omics clusters.
a The circular plot shows the hazard ratio (HR) of breast cancer-specific death and/or metastasis derived from a multivariate Cox regression model fitted on the set of 20 MOFs (upper), while also adjusting for age (bottom). The bold line presents the HR of the factors. The red circle marks the line of null effect. The shaded region shows the 95% confidence intervals. Factors 1, 2 and 13 highlighted in red are significantly associated with survival (Wald test P < 0.05). b By employing k-means clustering, the combination of BC-specific survival and metastasis-explaining factors (1,2 and 13) led to the formation of three multi-omics clusters (MOCs) -MOC1, MOC2 and MOC3- for the MOFA+ model. c The waffle chart elucidates the relative proportions of intrinsic subtypes within each MOCs. Each MOC is depicted as a block employing 25 × 4 grids, with each cell representing 1%,(totaling 100%). d The relative distribution of hormone receptors level (outer layer) within each MOCs (inner layer) is illustrated in the multi-level pie chart. The upper chart depicts ER level, while the lower chart shows the PR level. The MOC color keys follow from b. e The heat map of the expression levels of the top 20 MOFA+ derived significant transcripts, proteins, and all 18 metabolites.
Fig. 4
Fig. 4. Survival analysis of the multi-omics clusters and validation of the multi-omics clusters in external cohorts.
The Kaplan–Meier curves show overall long-term survival for different intrinsic subtype groups for all-cause mortality in a Oslo2, b TCGA and c the METABRIC cohort. The Kaplan–Meier curves show d overall survival for the different MOC groups and e BC-related death respectively. The log-rank p-value is inscribed on the plots. P-values from the log-rank test of the three clusters in addition to the pairwise log-rank test between MOCs are shown. The risk table is illustrated below the curves. f The forest plot illustrates hazard ratios (HR) of all cause mortality where MOC2 is the reference group, in comparison to MOC1 and MOC3 for the Oslo2 cohort. The estimated HR is represented by a box and the whiskers indicate the 95% confidence intervals. On the right side, Wald test p-values are shown. The Kaplan–Meier curves illustrate the overall long-term survival of MOCs in g TCGA and i the METABRIC cohort. p-values from the log-rank test of the three clusters in addition to pairwise log-rank test between MOCs are shown. h, j The waffle chart elucidates the relative proportions of intrinsic subtypes within each MOCs of TCGA and METABRIC respectively.
Fig. 5
Fig. 5. Systems-biology analysis comparing MOC1 and MOC2.
a Multi-omics pathway analysis incorporating the differentially expressed multi-omics features -transcriptomics, proteomics and metabolomics. The network topology including the enriched multi-omics pathways and the corresponding scores are provided in Supplementary Data 8. b MOC1 has upregulated glutamine transporters such as SLC1A5, SLC38A1/SLC38A2, and SLC6A14. These transporters are located on the cell membrane. Once inside the cell, the SLC1A5 transports glutamine to the mitochondrial matrix. The high expression of GLS in MOC1 implicates the glutaminolysis within the mitochondrial matrix. The glutamate derived from glutamine is then catalyzed into α-KG by the GLUD1, GOT2, and GPT2 enzymes. This conversion leads to the release of ammonia, aspartate, and alanine, respectively, and largely contributes to the maintenance of redox homeostasis. c Under glutamine deprivation in the MOC2 tumor cells, p53, a tumor suppressor protein upregulated in MOC2, triggers the expression of SLC1A4 and SLC7A4 transporters. SLC1A4 facilitates aspartate uptake and could lead to increased malate levels, an intermediate in the TCA cycle. This, in turn, may amplify oxidative phosphorylation and glutamine synthesis. Aspartate is also utilized for nucleotide synthesis. Furthermore, the possible mediation of arginine through the upregulated SLC7A4 transporter in MOC2 may explain the high expression of mTORC1 in MOC2, a protein suppressed during glutamine depletion. The intracellular asparagine levels rise also implicate the higher expressions of GLUL proteins in MOC2, leading to heightened glutamine and protein synthesis. The upregulation of p53 target genes (SESN1, GADD45A and CDKN1), as well as the phosphorylation of C/EBPβ and its target gene (SESN2) helps maintain energy and redox balance, ultimately promoting cancer cell survival in MOC2. GLS glutaminase, α-KG α-ketoglutarate, GLUD1 glutamate dehydrogenase 1, GOT glutamate oxaloacetate transaminase, GPT glutamate pyruvate transaminase, TCA tricarboxylic acid cycle, ROS reactive oxygen species, GLUL glutamate-ammonia ligase, C/EBPβ CCAAT/enhancer binding protein β. Pathways adapted from Jin, J et al. [34].

Similar articles

Cited by

References

    1. Sung H, Ferlay J, Siegel RL, Laversanne M, Soerjomataram I, Jemal A, et al. Global Cancer Statistics 2020: GLOBOCAN estimates of incidence and mortality worldwide for 36 cancers in 185 countries. CA Cancer J Clin. 2021;71:209–49. doi: 10.3322/caac.21660. - DOI - PubMed
    1. Loibl S, Poortmans P, Morrow M, Denkert C, Curigliano G. Breast cancer. Lancet. 2021;397:1750–69. doi: 10.1016/S0140-6736(20)32381-3. - DOI - PubMed
    1. Perou CM, Sorlie T, Eisen MB, van de Rijn M, Jeffrey SS, Rees CA, et al. Molecular portraits of human breast tumours. Nature. 2000;406:747–52. doi: 10.1038/35021093. - DOI - PubMed
    1. Sorlie T, Perou CM, Tibshirani R, Aas T, Geisler S, Johnsen H, et al. Gene expression patterns of breast carcinomas distinguish tumor subclasses with clinical implications. Proc Natl Acad Sci USA. 2001;98:10869–74. doi: 10.1073/pnas.191367098. - DOI - PMC - PubMed
    1. Prat A, Perou CM. Deconstructing the molecular portraits of breast cancer. Mol Oncol. 2011;5:5–23. doi: 10.1016/j.molonc.2010.11.003. - DOI - PMC - PubMed