. 2024 Jun 13;15(1):5078.
doi: 10.1038/s41467-024-49496-3.

E proteins control the development of NKγδT cells through their invariant T cell receptor

Affiliations

E proteins control the development of NKγδT cells through their invariant T cell receptor

Ariana Mihai et al. Nat Commun. .

Abstract

T cell receptor (TCR) signaling regulates important developmental transitions, partly through induction of the E protein antagonist, Id3. Although normal γδ T cell development depends on Id3, Id3 deficiency produces different phenotypes in distinct γδ T cell subsets. Here, we show that Id3 deficiency impairs development of the Vγ3+ subset, while markedly enhancing development of NKγδT cells expressing the invariant Vγ1Vδ6.3 TCR. These effects result from Id3 regulating both the generation of the Vγ1Vδ6.3 TCR and its capacity to support development. Indeed, the Trav15 segment, which encodes the Vδ6.3 TCR subunit, is directly bound by E proteins that control its expression. Once expressed, the Vγ1Vδ6.3 TCR specifies the innate-like NKγδT cell fate, even in progenitors beyond the normally permissive perinatal window, and this is enhanced by Id3-deficiency. These data indicate that the paradoxical behavior of NKγδT cells in Id3-deficient mice is determined by its stereotypic Vγ1Vδ6.3 TCR complex.


Conflict of interest statement

The authors declare no competing interests.

Figures
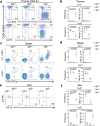
Fig. 1
Fig. 1. Impact of Id3-deficiency on development of γδ T cell subsets.
a, b Representative flow cytometry plots of thymocytes from Id3+/+, Id3+/-, and Id3−/− mice. a Flow cytometry plots of expression of CD24 and the indicated Vγ are displayed for CD4-CD8- thymocytes. b A graphical representation is depicted of the frequency and mean absolute number ± S.D. of Vγ2+ and Vγ1.1+ thymocytes from Id3+/+, Id3+/-, and Id3−/− mice calculated from gate frequencies. c Representative flow cytometry plots displaying staining for Vγ1.1 vs TCRδ, and Vγ2 vs TCRδ on splenocytes from Id3+/+, Id3+/-, and Id3−/− mice. d A graphical representation is depicted of the frequency and mean absolute number ± S.D. of Vγ2+ and Vγ1.1+ splenocytes from Id3+/+, Id3+/-, and Id3−/− mice calculated from gate frequencies. e Representative flow cytometry plots of Vγ2+ and Vγ3+ staining on skin preparations from Id3+/+, Id3+/-, and Id3−/− mice. f A graphical representation is depicted of the frequency and mean absolute number ± S.D. of Vγ2+ and Vγ3+ skin γδ T cells from Id3+/+, Id3+/-, and Id3−/− mice calculated from gate frequencies is depicted. 3 C57BL/6 background mice of the indicated genotypes were analyzed in the depicted experiment. Data are representative of 3 independent experiments. Statistical analysis: one-way ANOVA with correction for multiple comparison using Tukey’s post hoc test.
Fig. 2
Fig. 2. Effect of Id3-deficiency on fetal development of Vγ3 + γδ T cells.
a Representative flow cytometry plots of CD4/CD8 and TCRδ/Vγ3 staining of E17.5 thymocytes from Id3+/+, Id3+/-, and Id3−/− C57BL/6 background mice. b Graphic depiction of the mean absolute number ± S.D. of total thymocytes per lobe (left) or frequency (bottom) and absolute number (right) Vγ3+ γδ progenitors at E15.5 and at each of 4 additional days in fetal thymic organ culture (FTOC: right). c Mean frequency ± S.D. of the fraction of Vγ3+ γδ progenitors expressing CD122 is displayed graphically. 4 thymic lobes per genotype were analyzed at each time point. Statistical analysis: two-way ANOVA with correction for multiple comparison using Tukey’s post hoc test.
Fig. 3
Fig. 3. Alterations in Vγ1.1Vδ6.3 clonotypes in Id3-deficient mice.
a Pie charts depicting the frequencies of Vγ1.1Vδ6.3 CDR3 clonotypes identified by single-cell TCR sequencing in CD24hi and CD24low Vγ1.1Vδ6.3 thymocytes from Id3+/+ and Id3−/− mice. Id3+/+ CD24hi, n = 40; Id3+/+ CD24low, n = 37; Id3−/− CD24hi, n = 30; Id3−/− CD24low n = 30; b Logos depicting the length and diversity of CDR3 sequences from the Vγ1.1 and Vδ6.3 subunits of CD24hi and CD24low Vγ1.1Vδ6.3 thymocytes from Id3+/+ and Id3−/− mice. c Structural models of CDR3 sequences from the Vγ1.1 and Vδ6.3 subunits of CD24low Vγ1.1Vδ6.3 thymocytes from Id3+/+ and Id3−/− mice, depicting their predicted freedom of movement. Structure alignment of AlphaFold-Multimer v2.3 models of a single KO and a single WT γδ pair, chosen as representative of the sequence distribution. The frameworks and CDRs 1 and 2 are colored by TCG gene (delta=blue, gamma=orange). The CDRs are colored according to AlphaFold’s pLDDT scores, which are a measure of the predicted accuracy of the environment of each residue. The coloring ranges from blue (most confident) to red (least confident).
Fig. 4
Fig. 4. Capacity of Vγ1.1Vδ6.3 Tg from Id3+/+ and Id3−/− mice to support development of NKγδT cells.
a Diagram of Rosa26 targeted Vγ1.1Vδ6.3 TCR transgene. CAG transcription is blocked by a polyadenylation (pA) sequence in the LSL element. The Vγ1.1 and Vδ6.3 TCR chains are linked by a self-cleaving Tescovirus P2A sequence. ZsGreen fluorescent reporter is linked to the TCR construct by a self-cleaving T2A sequence. The amino acid sequence comparison of the generated TCR transgenes is shown. Sequence differences are in bold. b Diagram of in vivo experimental design, constructed using BioRender. Tamoxifen was administered to 6-week-old mice on days 1, 3, and 5, and analysis was performed on day 16. c Representative flow cytometry plots for ZsGreen+ cells stained with the indicated antibodies. Frequency of γδ T lymphocytes, and absolute numbers of γδ T cells, Vγ1.1Vδ6.3 expressing cells, and Vγ1+PLZF+ γδ T cells in Id3+/- and Id3−/− mice are depicted graphically (d) as scatter grams. Each dot represents an individual mouse and statistical significance was determined using two-way ANOVA with correction for multiple comparison using Tukey’s post hoc testing. Mean ± S.D. of the measurements is overlayed on the scatter grams. WT TCR Id3+/-, n = 14; WT TCR Id3−/−, n = 8; KO TCR Id3+/-, n = 11; KO TCR Id3−/−, n = 9.
Fig. 5
Fig. 5. Trav15 family members supporting development of NKγδT cells.
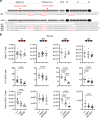
a ChIP-seq analysis of E2A and HEB binding to the C57BL/6 Tcra-Tcrd locus with positions of Eδ and Eα indicated by red arrows, and Trav15d-1-dv6d-1, Trav15n-1, and Trav15-1-dv6-1 indicated by green arrowheads. Progressively zoomed in view of the 150 kb region (b) or 3 kb region (c) highlighting the region of the Tcra-Tcrd locus corresponding to the Trav15d-1-dv6d-1 and Trav15-1-dv6-1 elements (green arrowheads). Blue bar with rightward checks indicates the location of the RSS. The maximum ChIP-seq peak value is indicated in the top left corner of the trace. Vertical blue lines in (a) denote V, D, and J gene segments, or constant region(s) as indicated. d Diagram of Tcra-Tcrd locus in 129 strain mice with relative positions of Trav15d-1-dv6d-1 and Trav15-1-dv6-1 indicated. Mutant alleles bearing deletions of Trav15d-1-dv6d-1 (Δ15d-1), Trav15-1-dv6-1 (Δ15-1), or the entire 430 kb interval (Δ430) are shown below. e Number of thymic TCRδ+ and Vγ1.1+Vδ6.3+ cells summarized from analysis of Δ430, Δ15-1, and Δ15d-1 mutants. Littermates were used for all comparisons. Δ15-1: Tcra+/+ (n = 10), Tcra+/Δ15-1 (n = 15), and TcraΔ15-1/Δ15-1 (n = 7); Δ15d-1: Tcra+/+ (n = 8), Tcra+/Δ15d-1 (n = 13), and TcraΔ15d-1/Δ15d-1 (n = 10); Δ430: Tcra+/+ (n = 6), Tcra+/Δ430 (n = 8), and TcraΔ430/Δ430 (n = 9) Data are plotted as mean ± SD and are pooled from at least 3 independent experiments. Statistical analysis: one-way ANOVA with correction for multiple comparison using Tukey’s post hoc testing. f The number of thymic TCRδ+ and Vγ1.1+Vδ6.3+ cells in Lck-Cre negative (LckN) Id3 sufficient (Id3fl/fl) (control), or Lck-Cre (LckP) mediated Id3 deficient (Id3fl/fl) Δ430, Δ15-1, and Δ15d-1 mutants. All comparisons to Lck-Cre negative (LckN) littermates. For Δ430: LckN (n = 9), LckP (n = 8); Δ15-1: LckN (n = 7), LckP (n = 7); Δ15d-1: LckN (n = 16) and LckP (n = 11). Data are pooled from at least 3 independent experiments and plotted as mean ± SD. Statistical analysis: Two-sided student’s t test.
Fig. 6
Fig. 6. Role of E protein binding in selection of Trav15 family V genes during NKγδT cell development.
a Diagram of Tcra-Tcrd locus in 129 strain mice with relative positions of Trav15d-1-dv6d-1 and Trav15-1-dv6-1 indicated. The region containing E-boxes adjacent to Trav15d-1-dv6d-1 RSS was mutated on the Δ15-1 allele to prevent compensatory usage of the Trav15-1-dv6-1 element. Mutations to the Ebox binding sites are indicated. b The number of thymic TCRδ+, and frequency and number of thymic Vγ1.1+Vδ6.3+ cells for each of the E box mutant mice (ΔE, ΔE3, mE3, and ΔE1) are depicted graphically as scatter plots. All comparisons represent littermates. ΔE: Tcra+/+ (n = 14), Tcra+/ΔE (n = 12), and TcraΔE/ΔE (n = 9); ΔE3: Tcra+/+ (n = 9), Tcra+/ΔE3 (n = 17), and TcraΔE3/ΔE3 (n = 10); mE3: Tcra+/+ (n = 6), Tcra+/mE3 (n = 9), and TcramE3/mE3 (n = 7); ΔE1: Tcra+/+ (n = 8), Tcra+/ΔE1 (n = 11), and TcraΔE1/ΔE1 (n = 13). Data were pooled from at least 3 independent experiments and are plotted as mean ± SD. Statistical analysis: one-way ANOVA with correction for multiple comparison using Tukey’s post hoc test.
Fig. 7
Fig. 7. Model of Id3 regulation of NKγδT cell development.
Separation of the αβ and γδ T cell lineages is dependent upon differences in TCR signal strength, with strong signals promoting the γδ T cell fate through suppression of E protein DNA binding through induction of the E protein antagonist Id3. Consistent with this model, development of most γδ T cell populations (e.g., Vγ3+ and KN6 γδ TCR transgenic progenitors) is attenuated when Id3 is eliminated through genetic ablation because their development requires Id3-mediated remodeling of E protein (E2A/HEB) regulation of important fate-specifying genes. In contrast, Vγ1Vδ6 expressing NKγδT cells are not suppressed, but are instead expanded. Our data indicate that this occurs because the absence of Id3 promotes the development of Vγ1Vδ6 expressing NKγδT cells in two ways. First, Id3-deficiency promotes the generation of the Vγ1Vδ6 TCR by enhancing E protein binding to the Trav15d-1 V gene that encodes the Vδ6 subunit. Second, in the absence of Id3, the stronger signals transduced by a selected subset (red) of Vγ1Vδ6 TCR complexes with higher affinity for ligand coopts Id2, which is capable of compensating for Id3 in modulating key γδ fate specifying gene targets. Id2 also contributes to the expression of key gene targets like Myc and Egr2, upon which NKγδT cell expansion depends. This figure was produced using BioRender using our full institutional license.

Similar articles

Cited by

References

    1. Parker ME, Ciofani M. Regulation of γδ T cell effector diversification in the thymus. Front. Immunol. 2020;11:42. doi: 10.3389/fimmu.2020.00042. - DOI - PMC - PubMed
    1. Ciofani M, Zúñiga-Pflücker JC. Determining γδ versus αß T cell development. Nat. Rev. Immunol. 2010;10:657–663. doi: 10.1038/nri2820. - DOI - PubMed
    1. Ciofani M, Knowles GC, Wiest DL, von Boehmer H, Zúñiga-Pflücker JC. Stage-specific and differential notch dependency at the alphabeta and gammadelta T lineage bifurcation. Immunity. 2006;25:105–116. doi: 10.1016/j.immuni.2006.05.010. - DOI - PubMed
    1. Hayes SM, Li L, Love PE. TCR signal strength influences alphabeta/gammadelta lineage fate. Immunity. 2005;22:583–593. doi: 10.1016/j.immuni.2005.03.014. - DOI - PubMed
    1. Lee SY, Stadanlick J, Kappes DJ, Wiest DL. Towards a molecular understanding of the differential signals regulating alphabeta/gammadelta T lineage choice. Semin. Immunol. 2010;22:237–246. doi: 10.1016/j.smim.2010.04.008. - DOI - PMC - PubMed

MeSH terms

Substances