. 2024 Jun 13;15(1):5069.
doi: 10.1038/s41467-024-49424-5.

Prostate cancer reshapes the secreted and extracellular vesicle urinary proteomes

Affiliations

Prostate cancer reshapes the secreted and extracellular vesicle urinary proteomes

Amanda Khoo et al. Nat Commun. .

Abstract

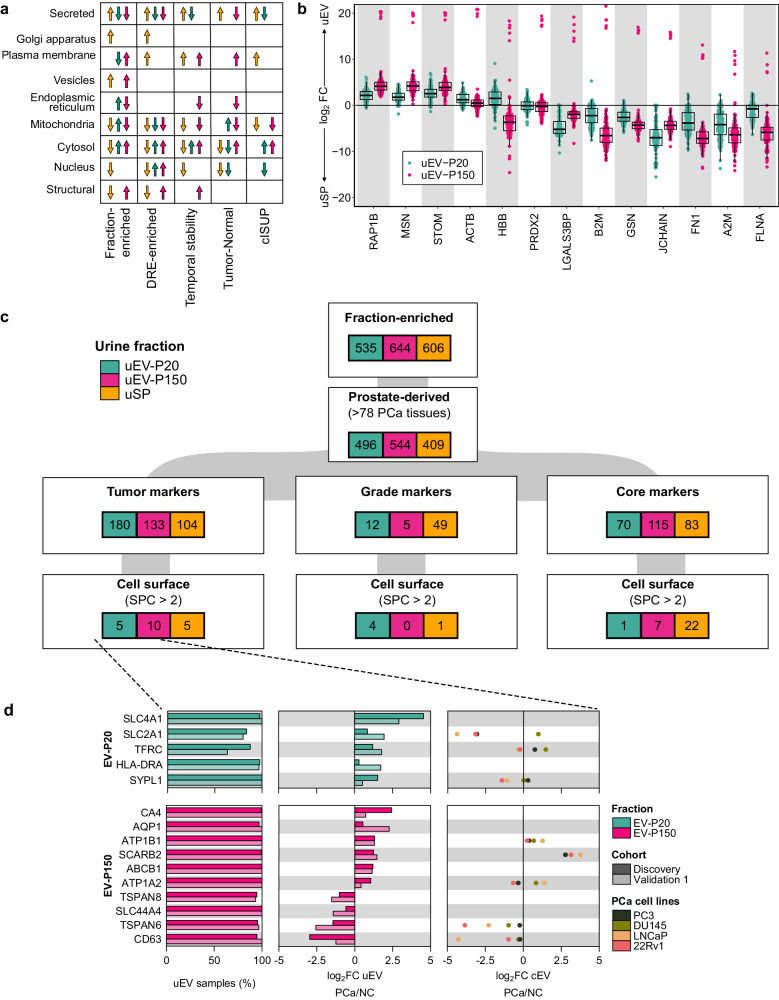
Urine is a complex biofluid that reflects both overall physiologic state and the state of the genitourinary tissues through which it passes. It contains both secreted proteins and proteins encapsulated in tissue-derived extracellular vesicles (EVs). To understand the population variability and clinical utility of urine, we quantified the secreted and EV proteomes from 190 men, including a subset with prostate cancer. We demonstrate that a simple protocol enriches prostatic proteins in urine. Secreted and EV proteins arise from different subcellular compartments. Urinary EVs are faithful surrogates of tissue proteomes, but secreted proteins in urine or cell line EVs are not. The urinary proteome is longitudinally stable over several years. It can accurately and non-invasively distinguish malignant from benign prostatic lesions and can risk-stratify prostate tumors. This resource quantifies the complexity of the urinary proteome and reveals the synergistic value of secreted and EV proteomes for translational and biomarker studies.


Conflict of interest statement

P.C.B. declares the following competing interests: P.C.B. sits on the Scientific Advisory Boards of Sage Bionetworks, Intersect Diagnostics Inc., and BioSymetrics Inc. The remaining authors declare no competing interests.

Figures

Fig. 1
Fig. 1. Digital rectal exam enriches for prostate tissue-derived proteins.
a Matched pre- and post-DRE urine proteomes from clinical International Society of Urological Pathology (cISUP) Grade Group (GG) 1 patients consisting of unfractionated urine (soluble proteins, uSP) and two subtypes of urinary extracellular vesicles (uEV) isolated by differential ultracentrifugation at 20,000 × g (uEV-P20) and 150,000 × g (uEV-P150). b Transmission electron microscopy images of uEVs isolated from pre- and post-DRE urine from a single individual. Scale bar: 200 nm. Images are representative of three biological replicates. ce Proteomic differences in pre- and post-DRE urines in uSP (c), uEV-P20 (d) and uEV-P150 (e) fractions. Top panel: log2 fold change (log2FC) in protein abundance in urine, grouped by protein detection in prostate tissues,. Bonferroni-corrected P-values from two-sided Mann–Whitney U tests. Bottom panel: log2FC in protein abundances. Prostate-specific proteins as per the Human Protein Atlas are in black. f Differences in pre- vs. post-DRE urine (log2FC) for select prostate tissue-specific proteins. Percentage of 157 prostate cancer (PCa) tissues, in which each protein was detected on the left. Background shading denotes P-value < 0.05 from a two-sided Wilcoxon signed-rank test. Source data are provided as a Source Data file.
Fig. 2
Fig. 2. Post-DRE uEV fractions harbor distinct protein cargo.
a Cohort overview. Clinical ISUP Grade Group (GG); cT: clinical T category; sPSA: Serum Prostate-Specific Antigen (ng mL−1); Age: Age at diagnosis (years). b Post-DRE urine fractions analyzed by proteomics, total patients, and samples per fraction. c Distribution of particle sizes determined by nanoparticle tracking analysis, mean of n = 22 (uEV-P20) and n = 34 (uEV-P150). d Representative transmission electron microscopy images of uEV fractions from one cISUP GG 1 patient. Scale bar: 200 nm. Images are representative of three biological replicates. e Particle concentration for uEV-P20 and uEV-P150 from 22 and 34 patients, respectively. f Number of proteins quantified by mass spectrometry. Dots represent samples (Samples: 175 uSP, 146 uEV-P20, 148 uEV-P150). P-values for (e, and f) from two-sided Mann–Whitney U tests. g Fraction of uEV-P20 and uEV-P150-unique proteins from 124 patients with matched uEV fractions. h Number of samples each protein was detected in (n = 96 patients). For each pairwise comparison, the numbers of proteins present in >90% of samples in one sample type and <10% of the other are labeled on top of each panel. i Differences in shared protein abundance between fractions. Significant differences (FDR < 0.05, two-sided Wilcoxon signed-rank test) are in green (uEV-P20), pink (uEV-P150) or yellow (uSP). n.s.: non-significant. Total differentially abundant proteins in bottom corners. n = 96 patients. j Fraction-enriched proteins either unique to one fraction or differentially abundant in one fraction relative to the other two. k Odds ratio (OR) of gene set enrichment for each subcellular localization for proteins from (j). Grey background shading indicates FDR < 0.05 (Fisher’s exact test). Boxplots are shown with the line indicating the sample median, the box indicating the 25th and 75th percentiles, and the whiskers indicating the ±1.5 × interquartile range (IQR). Source data are provided as a Source Data file.
Fig. 3
Fig. 3. uEV proteome closely reflects the prostate tissue proteome.
a Overlap in proteins quantified in each sample type. Samples: Urinary soluble proteins (uSP) = 175, uEV-P150 = 148, uEV-P20 = 146, Tissue = 157; Proteins: uSP = 3150, uEV-P150 = 3878, uEV-P20 = 5462, Tissue = 7438. b log2 median protein abundance between prostate tissue and uSP (left), uEV-P20 (middle), and uEV-P150 (right). Spearman’s rank correlation and its P-value (two-tailed) are shown. c Analysis strategy to identify tissue-associated genes in RNA-seq of normal or normal adjacent to tumor (NAT) prostate, bladder, and kidney from the Genotype-Tissue Expression project (GTEx) or The Cancer Genome Atlas (TCGA) (Supplementary Data 4). P-values from the two-sided Mann–Whitney U test adjusted using the Benjamini–Hochberg method (FDR). d Gene set variation analysis scores (GSVA) of sample types based on tissue-specific signatures (prostate: purple, kidney/bladder: grey). Samples: uSP = 175, uEV-P150 = 148, uEV-P20 = 146, Tissue = 157. P-values from two-sided Mann–Whitney U test. Boxplots are shown with the line indicating the sample median, the box indicating the 25th and 75th percentiles, and the whiskers indicating ±1.5 × IQR. e Gene Ontology: Cellular Component (GO:CC) gene sets over-represented in each sample type (Supplementary Data 3). Only significant gene sets (g:SCS-adjusted P-value < 0.05 from a Fisher’s one-tailed test in g:Profiler) are visualized. Source data are provided as a Source Data file.
Fig. 4
Fig. 4. Prostate cancer cell line EVs do not fully reflect prostate fluid EVs.
a Overview of cell line EV (cEV) isolation from conditioned media. b Overlap in proteins quantified between sample types. ce Spearman’s correlation between log2 mean protein abundance in patient and cell line fractions. Cell line protein abundances are the mean of three experimental replicates from five cell lines. f log2FC between EV-P150 and EV-P20 in uEV (x-axis) vs. cEV (y-axis). Significantly differentially abundant proteins in both uEV and cEV (two-sided Mann–Whitney U test FDR < 0.05) are pink (more abundant in EV-P150) or green (more abundant in EV-P20). Grey dots represent non-significant proteins (n.s., FDR ≥ 0.05). g Organellar enrichment for proteins (two-proportion z-test) in each quadrant from (d) (left panel), annotated with differences in fraction (middle panel) between EV-P150 (top right quadrant) and EV-P20 (bottom left quadrant) and P-value (right panel). Source data are provided as a Source Data file.
Fig. 5
Fig. 5. uEV proteome is temporally stable and reflects clinical behavior.
a Time points for each post-DRE urine collection in a cohort of five patients with cISUP Grade Group (GG) 1 tumors on active surveillance that did not upgrade over the course of urine collection. b Correlation in protein abundance (Spearman’s ρ) within individuals (Intra, green, 5 patients with cISUP GG 1 tumors), and between individuals (Inter, grey; patients: uSP = 150, uEV-P20 = 126, uEV-P150 = 128). P-values from two-sided Mann–Whitney U tests. Boxplots are shown with the line indicating the sample median, the box indicating the 25th and 75th percentiles, and the whiskers indicating ±1.5 × IQR. ce Significantly differentially abundant proteins between prostate cancers (PCa, red) vs. non-cancers (NC, blue) using a two-sided Mann–Whitney U test FDR < 0.05. n.s.: Non-significant, grey. NC patients for uSP and uEV are not matched. Patients: uSPNC = 39, uSPPCa = 136, uEV-P20NC = 22, uEV-P20PCa = 132, uEV-P150NC = 25, uEV-P150PCa = 131. Source data are provided as a Source Data file.
Fig. 6
Fig. 6. Prioritization of urinary proteins for biomarker discovery.
a Strategy for urinary protein selection and building models to classify prostate cancers (PCa) vs. non-cancers (NC), and cISUP GG 1 vs. GG > 1. uSP: urinary soluble proteins; U test: two-sided Mann–Whitney U test; RFE: recursive feature elimination; GLM: generalized linear model; KNN: k-nearest neighbors; LOOCV: leave-one-out cross-validation; AUC: area under the receiver operator characteristic (ROC) curve. b ROC curves for multi-protein models (solid line) and serum PSA (dotted line) for classifying PCa vs. NC in the discovery cohort. (Patients: uSPNC = 39, uSPPCa = 136, uEV-P20NC = 22, uEV-P20PCa = 132, uEV-P150NC = 25, uEV-P150PCa = 131). c log2 fold changes (log2FC) of proteins in multi-protein models (b) in the discovery cohort (Patients: uSPNC = 39, uSPPCa = 136, uEV-P20NC = 22, uEV-P20PCa = 132, uEV-P150NC = 25, uEV-P150PCa = 131) and an independent prospective validation cohort (30 patients each for uSP, uEV-P20 and uEV-P150; PCa = 16, NC = 14). d ROC curves for multi-protein models and serum PSA in classifying PCa vs. NC in an independent validation cohort (30 patients each for uSP, uEV-P20, and uEV-P150; PCa = 16, NC = 14). Source data are provided as a Source Data file.
Fig. 7
Fig. 7. EV cargo is context-dependent.
a Proteins differentially abundant in each condition and urine fraction by compartment. b Differences in protein abundance of extracellular vesicle markers from ref. in matched uEV-P20 (green) and uEV-P150 (pink) relative to uSP. n = 96 patients. Boxplots are shown with the line indicating the sample median, the box indicating the 25th and 75th percentiles, and the whiskers indicating ±1.5 × IQR. c Fraction-specific proteins were determined by differential protein abundance and frequency of detection (Fig. 2j). Proteins in each subset were filtered based on the following criteria. Tumor markers: |log2FC | PCa/NC > 1 and FDR PCa/NC < 0.05; Grade markers: |log2FC | cISUP>1/cISUP=1 > 1 and unadjusted PcISUP>1/cISUP=1 < 0.05; Core markers: |log2FC | PCa/NC < 1 and FDR PCa/NC ≥ 0.05 and |log2FC | cISUP>1/cISUP=1 > 1 and unadjusted PcISUP>1/cISUP=1 ≥ 0.05 and >90% of samples and <25% least variant proteins. Tumor, grade, and core markers were further filtered to select cell surface markers (SPC >2). PCa: Prostate cancer; NC: Non-cancer; SPC: Surface prediction consensus. P-values from a two-sided Mann–Whitney U test. d Tumor markers with predicted cell surface localization from (c). Proteins are annotated with the frequency of detection in each fraction (left panel) and differential abundance in PCa vs. NC in uEV (middle panel) and cEV (right panel). Non-cancer (NC) cEVs from RWPE1 cell line. Source data are provided as a Source Data file.

Update of

References

    1. Ridley, J. W. Fundamentals of the Study of Urine and Body Fluids. (Springer, Cham, Switzerland, 2018).
    1. Drake RR, et al. Clinical collection and protein properties of expressed prostatic secretions as a source for biomarkers of prostatic disease. J. Proteome Res. 2009;72:907–917. doi: 10.1016/j.jprot.2009.01.007. - DOI - PMC - PubMed
    1. Simerville JA, Maxted WC, Pahira JJ. Urinalysis: a comprehensive review. Am. Fam. Physician. 2005;71:1153–1162. - PubMed
    1. Nagaraj N, Mann M. Quantitative analysis of the intra- and inter-individual variability of the normal urinary proteome. J. Proteome Res. 2011;10:637–645. doi: 10.1021/pr100835s. - DOI - PubMed
    1. Tomlins SA, et al. Urine TMPRSS2:ERG plus PCA3 for individualized prostate cancer risk assessment. Eur. Urol. 2016;70:45–53. doi: 10.1016/j.eururo.2015.04.039. - DOI - PMC - PubMed