. 2024 Jun 13;15(1):5055.
doi: 10.1038/s41467-024-49380-0.

Tissue-intrinsic beta-catenin signals antagonize Nodal-driven anterior visceral endoderm differentiation

Affiliations

Tissue-intrinsic beta-catenin signals antagonize Nodal-driven anterior visceral endoderm differentiation

Sina Schumacher et al. Nat Commun. .

Abstract

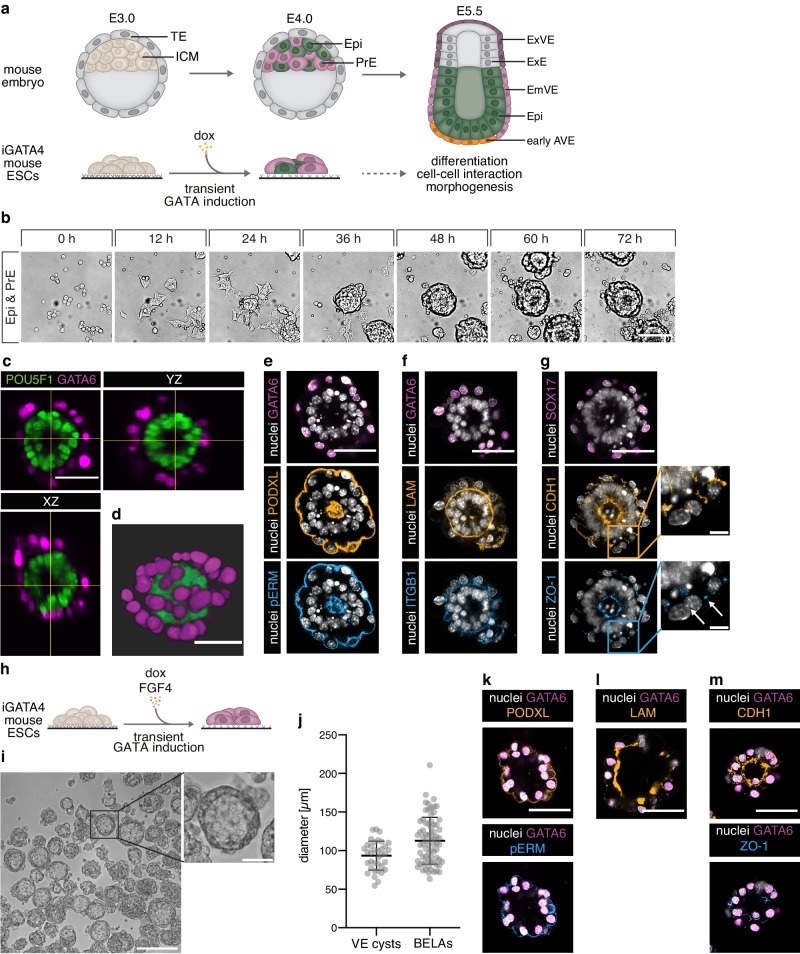
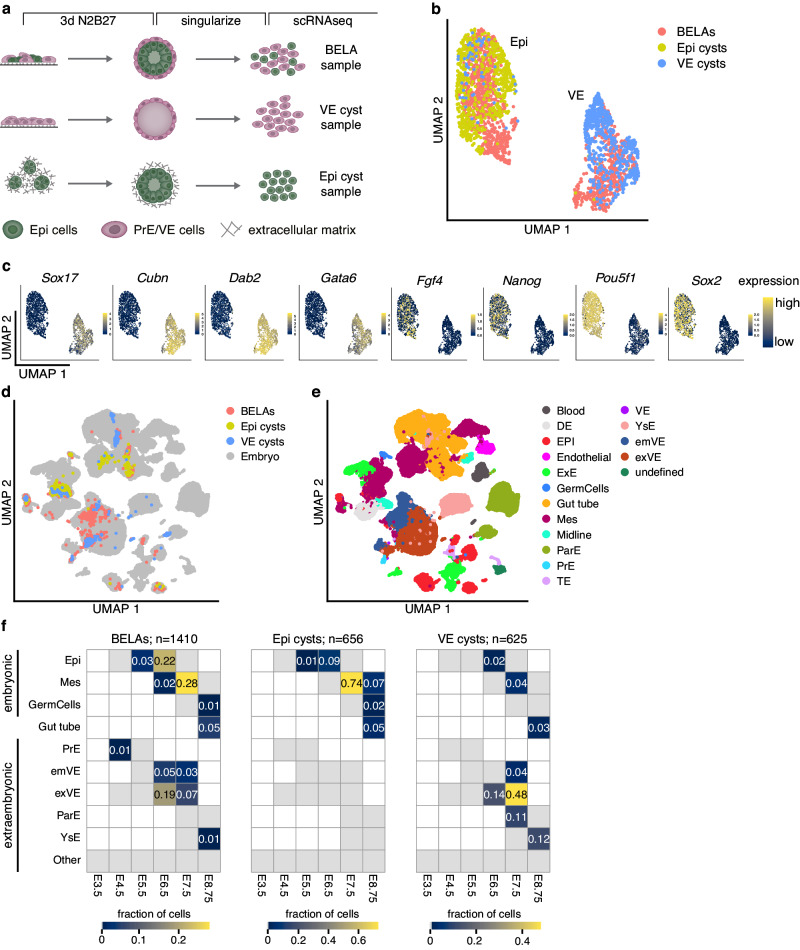
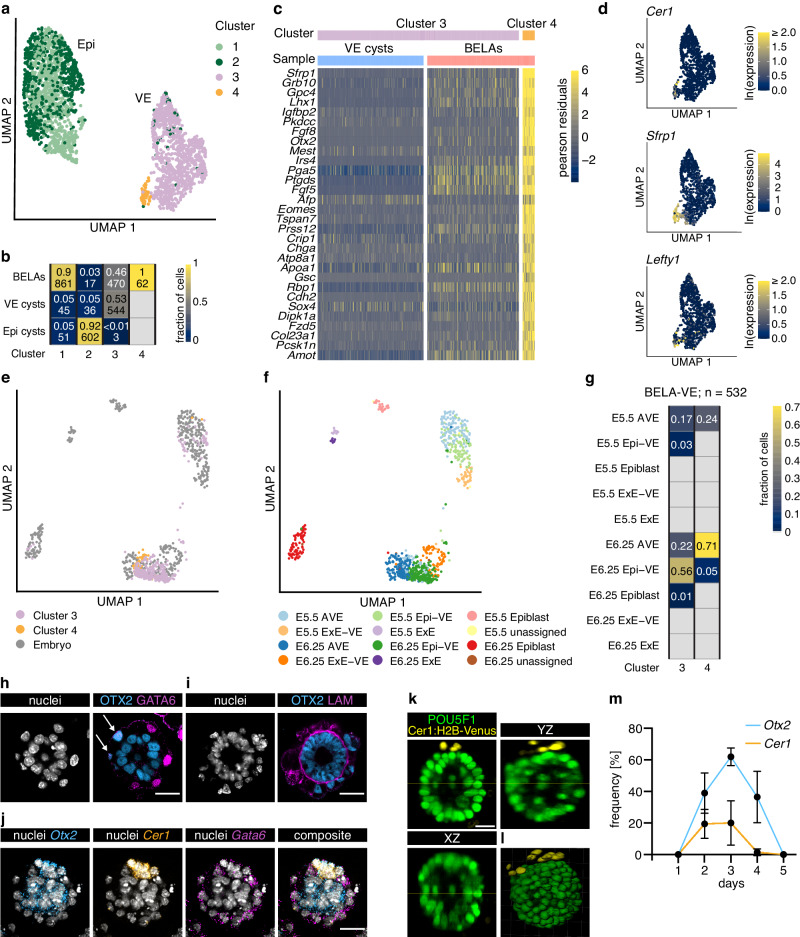
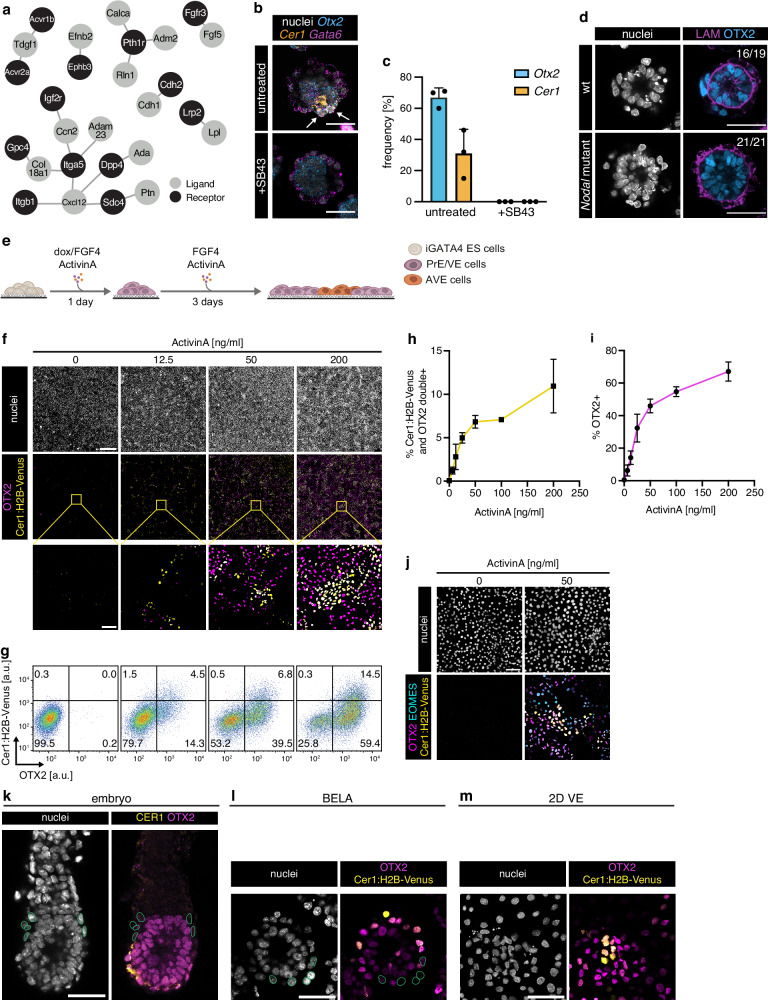
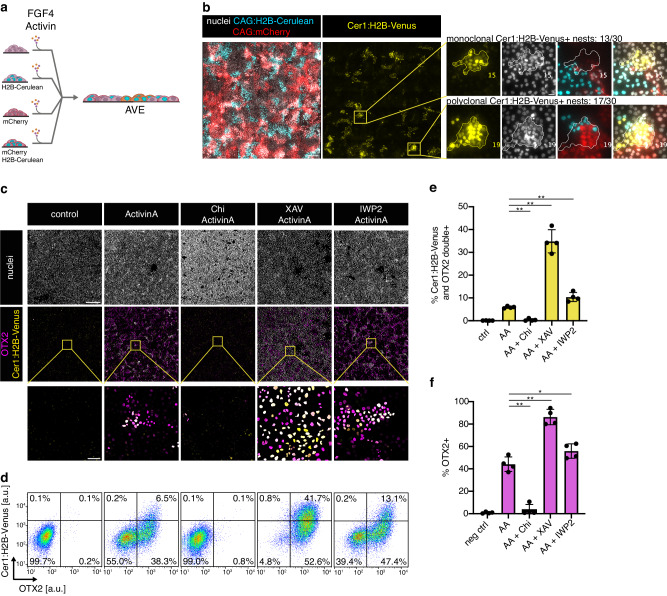
The anterior-posterior axis of the mammalian embryo is laid down by the anterior visceral endoderm (AVE), an extraembryonic signaling center that is specified within the visceral endoderm. Current models posit that AVE differentiation is promoted globally by epiblast-derived Nodal signals, and spatially restricted by a BMP gradient established by the extraembryonic ectoderm. Here, we report spatially restricted AVE differentiation in bilayered embryo-like aggregates made from mouse embryonic stem cells that lack an extraembryonic ectoderm. Notably, clusters of AVE cells also form in pure visceral endoderm cultures upon activation of Nodal signaling, indicating that tissue-intrinsic factors can restrict AVE differentiation. We identify β-catenin activity as a tissue-intrinsic factor that antagonizes AVE-inducing Nodal signals. Together, our results show how an AVE-like population can arise through interactions between epiblast and visceral endoderm alone. This mechanism may be a flexible solution for axis patterning in a wide range of embryo geometries, and provide robustness to axis patterning when coupled with signal gradients.


Conflict of interest statement

The authors declare no competing interests.

Figures

Fig. 1
Fig. 1. Formation and characterization of BELAs and VE cysts.
a Schematic of mouse embryonic development from E3.0 to E5.5 (top) and GATA4-inducible embryonic stem cell (ESC) system to model interactions between epiblast (Epi) and extraembryonic endoderm (bottom). b Stills from a movie of ESC-derived Epi and primitive endoderm (PrE) cells seeded on a low adhesion substrate in N2B27 medium. See also Supplementary Movie 1. One representative out of n = 3 independent experiments shown. c, d Orthogonal views (c) and 3D volume rendering (d) of a bilayered aggregate imaged with light sheet microscopy. POU5F1 (green) marks Epi identity and GATA6 (magenta) marks PrE/VE identity. See also Supplementary Movie 2. One representative out of n = 5 structures shown. eg Immunostainings of bilayered aggregates for the PrE/VE markers GATA6 ((e), (f)) or SOX17 (magenta, g), the apical markers PODXL (orange) and pERM (blue) (e), the basement membrane and adhesion markers LAM (orange) and ITGB1 (blue) (f), and the epithelial markers CDH1 (orange) and ZO-1 (blue) (g). One representative out of at least n = 7 structures shown. Arrows in (g, inset) mark punctate ZO-1 staining characteristic for tight junctions. h Schematic of experimental protocol to differentiate pure populations of PrE cells. i VE cysts formed in N2B27 supplemented with FGF4 on a low adhesive substrate. One out of n = 3 independent experiments shown. j Diameters of detached BELAs and VE cysts grown for 3 days on a low adhesive substrate. n = 72 (BELAs) and n = 36 (VE cysts); bars indicate mean ± SD. km Immunostainings of VE cysts for the same markers as in eg. One representative out of at least n = 7 structures shown. Scale bars: 50 µm in (bg, i (inset) and km), 10 µm in g (inset), 200 μm in i. Source data for j are provided in the Source Data file.
Fig. 2
Fig. 2. Single-cell RNA-sequencing and data integration to determine cell type identities in BELAs and cysts.
a Experimental approach to prepare samples for scRNAseq. b UMAP of batch corrected single-cell transcriptomes from cells prepared as in a. Colors indicate sample of origin. c Expression levels of VE markers Gata6, Sox17, Dab2, and Cubn, and Epi markers Pou5f1, Sox2, Nanog, and Fgf4. To better visualize the cell type-specific expression of Fgf4, Nanog and Sox2, expression levels above ln ≥1.5 (Fgf4) or ln ≥2 (Nanog and Sox2) are shown in yellow. d UMAP of single-cell transcriptomes from BELAs, Epi cysts and VE cysts, integrated with scRNAseq data from mouse embryos covering stages E4.5 to E8.75. e Same UMAP as in d, colored according to cell type annotation from after integration and label transfer. f Heatmaps showing the fraction of cells in BELAs (left), Epi cysts (middle) and VE cysts (right) assigned to particular cell types and time points from the embryo. Because the E8.75 gut tube has both embryonic and extraembryonic origin,, it was not assigned to any of the two categories.
Fig. 3
Fig. 3. AVE differentiation in BELAs.
a UMAP representation of single-cell transcriptomes (same as in Fig. 2b), colored according to Louvain clustering. b Heatmap showing the fraction and total number of cells from each sample in the four clusters from a. The small number of cells from VE cysts in clusters 1 and 2 likely originate from cells that were refractory to PrE differentiation (see above, and Raina et al.), c Heatmap showing the 30 most upregulated genes between the cells of cluster 3 and cluster 4 in (a), ordered by log2-fold change. Single-cell expression is shown as the Pearson residual of the normalized counts. d Zoom-in in UMAP from (a) showing expression of Cer1, Sfrp1, and Lefty1 in VE cells. e UMAP of single-cell transcriptomes from BELA-VE cells (Cluster 3 and Cluster 4 in a, b), integrated with scRNAseq data from mouse embryos at E5.5 and E6.25 from. f Same UMAP as in e, colored according to cell type annotation from after integration and label transfer. g Heatmap showing the fraction of BELA-VE cells assigned to particular cell types and developmental time points from the embryo. h Immunostaining for the AVE marker OTX2 (blue) and the VE marker GATA6 (magenta). Arrows highlight co-expression. i Immunostaining for the AVE marker OTX2 (blue) and the basement membrane marker LAM (magenta). h, i one representative out of a total of at least 13 structures from n = 2 independent experiments shown. j In situ HCR staining for the AVE markers Otx2 (blue) and Cer1 (orange), and the VE marker Gata6 (magenta). One representative out of a total of at least 60 structures from n = 3 independent experiments shown. k, l Orthogonal views (k) and 3D volume rendering (l) of a BELA stained for the Epi marker POU5F1 (green) and the AVE reporter Cer1:H2B-Venus (yellow) imaged with light sheet microscopy. One representative out of a total of 28 structures from n = 3 independent experiments shown. m Mean frequency of AVE marker gene expression in BELAs on different days after re-seeding. Otx2 expression was scored as AVE marker only if it could clearly be assigned to the outer layer of BELAs. n = 2 independent experiments, for number of BELAs analyzed at each timepoint see Source Data file. Error bars indicate SD. Scale bars: 25 µm.
Fig. 4
Fig. 4. Activin/Nodal signaling is necessary and sufficient for AVE differentiation.
a Output of ligand-receptor analysis with LIANA, showing the top 20 interactions between Epi-derived ligands and VE-derived receptors. b In situ HCR staining of untreated (top) and SB43-treated (bottom) BELAs for AVE markers Otx2 (blue) and Cer1 (orange) and the PrE/VE marker Gata6 (magenta). c Mean frequency of AVE marker gene expression in untreated and SB43-treated BELAs 3 days after re-seeding. Data in b, c from n = 3 independent experiments, one representative structure shown in b. Error bars in (c) indicate SD. d Immunostaining for LAM (magenta) and OTX2 (blue) in BELAs made from Nodal wild-type (top) and Nodal-mutant cells (bottom). At least 19 structures each from n = 3 independent Nodal-mutant clones were imaged, one representative structure shown. e Schematic of experimental protocol to generate 2D layers of VE cells for AVE differentiation. f Immunostaining for OTX2 (magenta) and H2B-Venus (yellow) of Cer1:H2B-Venus reporter cells treated with indicated concentrations of ActivinA for 3 days after an extended doxycycline pulse. One out of n = 3 independent experiments shown. g Flow cytometry of cells differentiated and stained as in f. h Mean percentage of Cer1:H2B-Venus; OTX2 double-positive cells differentiated with increasing doses of ActivinA. n = 3 independent experiments, error bars indicate SD. i Same as h but showing percentage of OTX2-positive cells. j Immunostaining for OTX2 (magenta), EOMES (cyan), and H2B-Venus (yellow) of Cer1:H2B-Venus reporter cells treated as in f. One out of n = 2 independent experiments shown. km Immunostaining of a E5.5 mouse embryo (k, n = 3 embryos), a BELA (l, n = 21 BELAs), and cells in a 2D VE layer (m, n = 4 independent experiments) for OTX2 (magenta) and CER1 protein (k), or the Cer1:H2B-Venus reporter (l, m) (yellow). Green circles in k, l indicate OTX2-negative nuclei of cells in contact with the epiblast compartment. Scale bars: 50 µm in b, d, ((f) inset), (j), (km); 500 µm in f. Source data for c, h, i are provided in the Source Data file.
Fig. 5
Fig. 5. Tissue-intrinsic β-catenin signals regulate AVE differentiation.
a Experimental approach to determine clonal composition of AVE nests. b Expression of clonal labels (red, cyan) and Cer1:H2B-Venus reporter (yellow) in cultures differentiated as in a. Insets on the right show examples of Cer1:H2B-Venus-expressing nests with a single clonal label (top, 13/30 nests), or with multiple labels (bottom, 17/30 nests). One out of n = 2 independent experiments shown. c Immunostaining for OTX2 (magenta) and H2B-Venus (yellow) of Cer1:H2B-Venus reporter cells differentiated for 3 days after an extended doxycycline pulse with 50 ng/ml ActivinA (AA), together with 3 µM Chir99021 (Chi), 20 µM XAV939 (XAV), or 2 µM IWP2 as indicated. One out of n = 3 independent experiments shown. d Flow cytometry of cells differentiated and stained as in c. e Mean percentage of Cer1:H2B-Venus; OTX2 double-positive cells differentiated as in c. n = 4 independent experiments, error bars indicate SD. **p < 0.001 for AA vs. AA + Chi and AA vs. AA + XAV, and p = 0.0045 for AA vs. AA + IWP2 (two-tailed, unpaired t-test). f Same as e but showing percentage of OTX2-positive cells. **p < 0.001 for AA vs. AA + Chi and p = 0.0001 for AA vs. AA + XAV, *p = 0.0434 for AA vs. AA + IWP2 (two-tailed, unpaired t-test). Scale bars: 200 µm ((b) overview); 20 µm ((b) inset); 500 µm ((c) overview); 50 µm ((c) inset). Source data for e, f are provided in the Source Data file.

Similar articles

Cited by

References

    1. Hoshino H, Shioi G, Aizawa S. AVE protein expression and visceral endoderm cell behavior during anterior–posterior axis formation in mouse embryos: Asymmetry in OTX2 and DKK1 expression. Dev. Biol. 2015;402:175–191. doi: 10.1016/j.ydbio.2015.03.023. - DOI - PubMed
    1. Nowotschin S, et al. The T-box transcription factor Eomesodermin is essential for AVE induction in the mouse embryo. Genes Dev. 2013;27:997–1002. doi: 10.1101/gad.215152.113. - DOI - PMC - PubMed
    1. Stower MJ, Srinivas S. The head’s tale: anterior-posterior axis formation in the mouse embryo. Curr. Top. Dev. Biol. 2018;128:365–390. doi: 10.1016/bs.ctdb.2017.11.003. - DOI - PubMed
    1. Brennan J, et al. Nodal signalling in the epiblast patterns the early mouse embryo. Nature. 2001;411:965–969. doi: 10.1038/35082103. - DOI - PubMed
    1. Rodriguez TA, Srinivas S, Clements MP, Smith JC, Beddington RSP. Induction and migration of the anterior visceral endoderm is regulated by the extra-embryonic ectoderm. Development. 2005;132:2513–2520. doi: 10.1242/dev.01847. - DOI - PubMed