. 2024 Jun 13;14(1):13605.
doi: 10.1038/s41598-024-64384-y.

Serum cytokine dysregulation signatures associated with COVID-19 outcomes in high mortality intensive care unit cohorts across pandemic waves and variants

Collaborators, Affiliations

Serum cytokine dysregulation signatures associated with COVID-19 outcomes in high mortality intensive care unit cohorts across pandemic waves and variants

Henrike Maaß et al. Sci Rep. .

Abstract

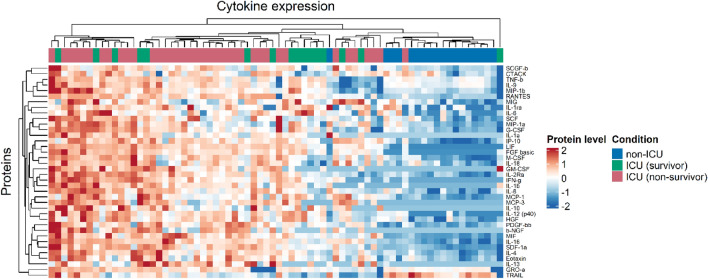
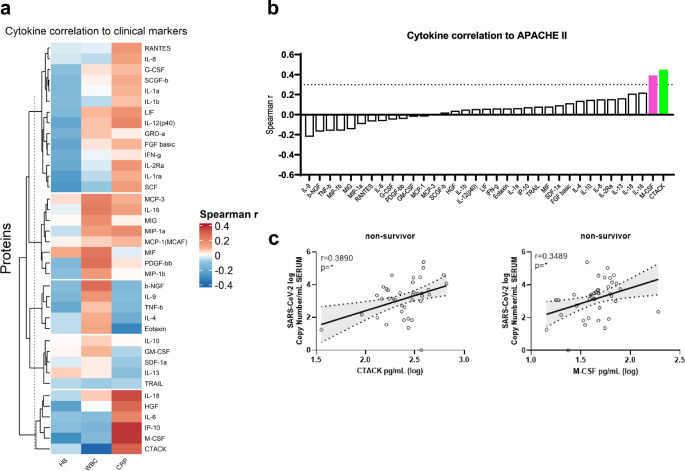
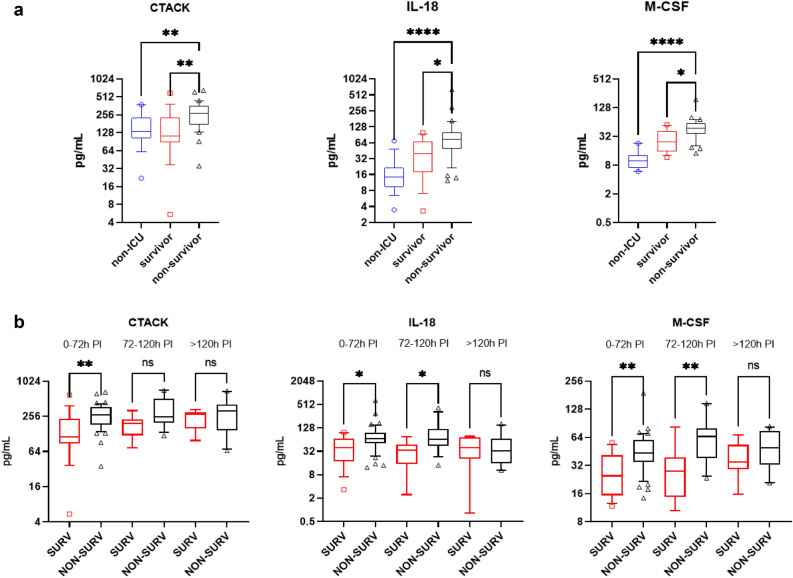
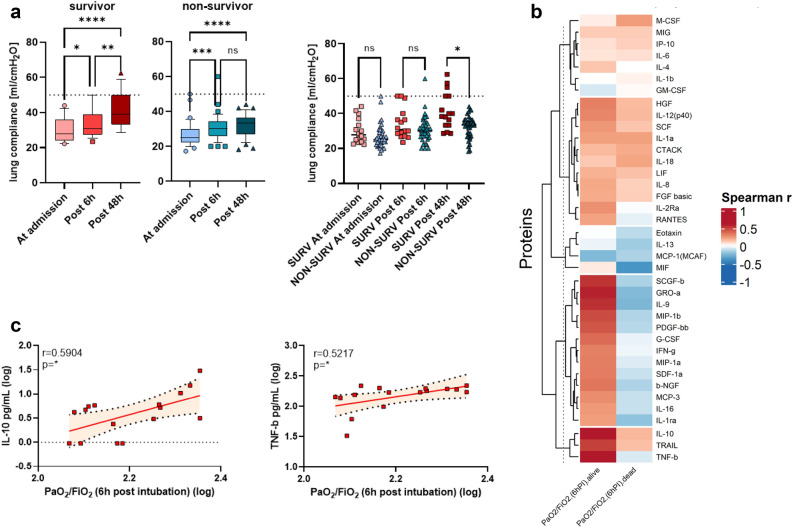
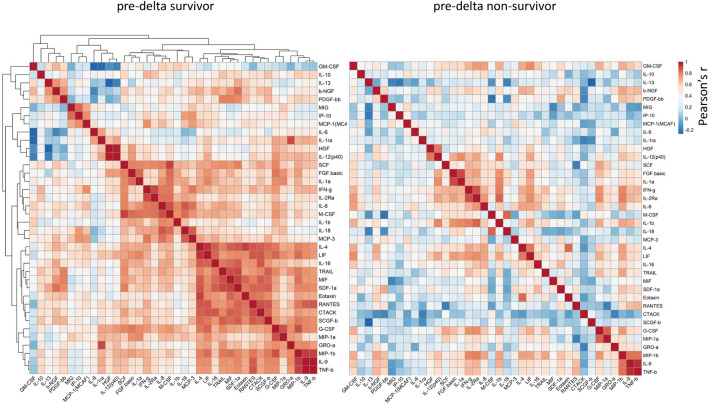
The aim of this study was to characterize the systemic cytokine signature of critically ill COVID-19 patients in a high mortality setting aiming to identify biomarkers of severity, and to explore their associations with viral loads and clinical characteristics. We studied two COVID-19 critically ill patient cohorts from a referral centre located in Central Europe. The cohorts were recruited during the pre-alpha/alpha (November 2020 to April 2021) and delta (end of 2021) period respectively. We determined both the serum and bronchoalveolar SARS-CoV-2 viral load and identified the variant of concern (VoC) involved. Using a cytokine multiplex assay, we quantified systemic cytokine concentrations and analyzed their relationship with clinical findings, routine laboratory workup and pulmonary function data obtained during the ICU stay. Patients who did not survive had a significantly higher systemic and pulmonary viral load. Patients infected with the pre-alpha VoC showed a significantly lower viral load in comparison to those infected with the alpha- and delta-variants. Levels of systemic CTACK, M-CSF and IL-18 were significantly higher in non-survivors in comparison to survivors. CTACK correlated directly with APACHE II scores. We observed differences in lung compliance and the association between cytokine levels and pulmonary function, dependent on the VoC identified. An intra-cytokine analysis revealed a loss of correlation in the non-survival group in comparison to survivors in both cohorts. Critically ill COVID-19 patients exhibited a distinct systemic cytokine profile based on their survival outcomes. CTACK, M-CSF and IL-18 were identified as mortality-associated analytes independently of the VoC involved. The Intra-cytokine correlation analysis suggested the potential role of a dysregulated systemic network of inflammatory mediators in severe COVID-19 mortality.

Keywords: Biomarker; COVID-19; Cytokines; Mortality; SARS-CoV-2; Variant of concern.


Conflict of interest statement

LCS received consulting fees by CORAT Therapeutics, DIGID Diagnostics, Dr. Wolff Group and SANOFI Pharma. LCS received speaker’s honoraria by SWIXX Pharma and SANOFI Pharma. LCS has the following patents: EP3655526 and EP22153256.7. LCS has unpaid positions in the HZI Board of Trustees, he is a member of the Vaccine task force of the European Federation of Immunological Societies and is the co-coordinator for the Vaccine group of the German Immunological Society. Other authors have no competing interest.

Figures

Figure 1
Figure 1
Cytokine analysis of hospitalized COVID-19 patients. Heatmap of log-transformed cytokine concentrations of samples of the earliest time points. Patients are represented per column and patient conditions are indicated by column annotations. Cytokines are represented by rows. Clustering was performed based on Euclidean distance.
Figure 2
Figure 2
Cytokine association to clinical marker. (a) Spearman correlation analysis of cytokines to hemoglobin (HB) values, white blood cell count (WBC) and C reactive protein (CRP) was performed. Red indicates positive correlation, blue negative correlation. (b) Waterfall plot of Spearman correlation from cytokines to APACHE II scores. The dotted line indicates values above rS = 0.3 and cytokines with statistically significant correlation (M-CSF (magenta) and CTACK (green)). (c) Correlation of CTACK and M-CSF to SARS-CoV-2 viral load in serum samples of ICU non-survivors (black). Pearson analysis was performed. Linear-regression is shown as well as the 90% CI indicated by the dotted lines. ns = non-significant; * = p < 0.05.
Figure 3
Figure 3
Analysis of mortality associated cytokines. (a) CTACK, IL-18 and M-CSF showed a significant increase in ICU non-survivors (black triangles) in comparison to ICU survivors (red squares). For analysis, a one-way ANOVA Kruskal–Wallis followed by Dunn’s correction was performed. Box plot showing the median of each group and the 10–90 percentile. (b) Individual samples of all patients were pooled according to their sampling period post-intubation (PI) and analyzed using the Kruskal–Wallis with Dunn’s correction test. The box plot shows the median of each group with the 10–90% percentiles. ns = non-significant; * = p < 0.05; ** = p < 0.01; **** = p < 0.0001.
Figure 4
Figure 4
Analysis of cytokines and lung function. (a) Lung compliance was calculated for all patients. For analysis of survivors and non-survivors (left and middle graph) a Friedmann test or for the comparison of survivor to non-survivor (right graph) a one-way ANOVA Kurskal-Wallis followed by Dunn’s correction was performed. Box plots show the median of each group and the 10–90 percentile. Dot plots show the individual values of each patient (red = survivor, blue = non-survivor). The dotted line indicates 50 ml/cmH2O which is the lung compliance of a healthy individual. (b) Heatmap of Spearman correlation analysis of cytokines to the PaO2/FiO2 ratio at 6h post intubation. Red indicates positive correlation, blue negative correlation. (c) Individual correlation plot of PaO2/FiO2 ratio at 6h post intubation to IL-10 and TNF-β concentrations in ICU survivor. ns = non-significant; * = p < 0.05; ** = p < 0.01;*** = p < 0.001; **** = p < 0.0001.
Figure 5
Figure 5
Cytokine-to-Cytokine correlation analysis. Cytokine concentrations were log transformed and a parametric Pearson correlation analysis was performed. Rows and columns represent cytokines. Red symbolized positive correlation and blue negative correlation. Cytokines were clustered according to Euclidean distance. The order of cytokines both in the rows and columns are equal between survivor and non-survivor. (a) Correlation heatmap of samples from the first time point (24-36h post intubation. (b) correlation heatmap of samples from the second time point (48-72h after the first sampling). Samples from 10/16 survivor and 20/38 non-survivor were available at the second time point due to earlier release from ICU or passing away from patients.

References

    1. Berlin DA, Gulick RM, Martinez FJ. Severe Covid-19. N. Engl. J. Med. 2020;383(25):2451–2460. doi: 10.1056/NEJMcp2009575. - DOI - PubMed
    1. Abers MS, Delmonte OM, Ricotta EE, Fintzi J, Fink DL, de Jesus AAA, et al. An immune-based biomarker signature is associated with mortality in COVID-19 patients. JCI Insight. 6(1): (2021). - PMC - PubMed
    1. Balnis J, Adam AP, Chopra A, Chieng HC, Drake LA, Martino N, et al. Unique inflammatory profile is associated with higher SARS-CoV-2 acute respiratory distress syndrome (ARDS) mortality. Am. J. Physiol. Regul. Integr. Comp. Physiol. 2021;320(3):R250–R257. doi: 10.1152/ajpregu.00324.2020. - DOI - PMC - PubMed
    1. Lucas C, Wong P, Klein J, Castro TBR, Silva J, Sundaram M, et al. Longitudinal analyses reveal immunological misfiring in severe COVID-19. Nature. 2020;584(7821):463–469. doi: 10.1038/s41586-020-2588-y. - DOI - PMC - PubMed
    1. Bulow Anderberg S, Luther T, Berglund M, Larsson R, Rubertsson S, Lipcsey M, et al. Increased levels of plasma cytokines and correlations to organ failure and 30-day mortality in critically ill Covid-19 patients. Cytokine. 2021;138:155389. doi: 10.1016/j.cyto.2020.155389. - DOI - PMC - PubMed