

Untargeted metabolomics reveal signatures of a healthy lifestyle
- PMID: 38871777
- PMCID: PMC11176323
- DOI: 10.1038/s41598-024-64561-z
Untargeted metabolomics reveal signatures of a healthy lifestyle
Abstract
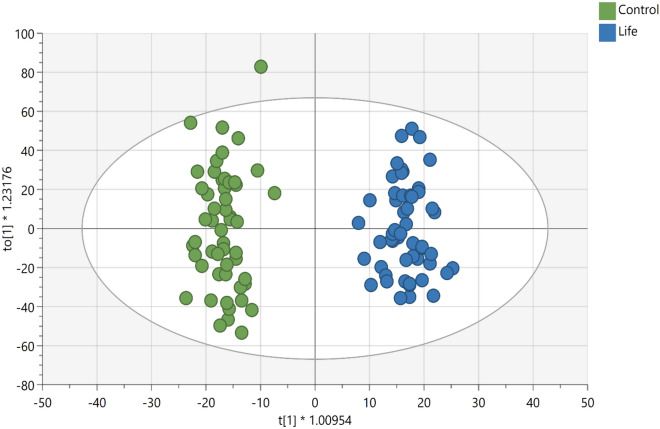
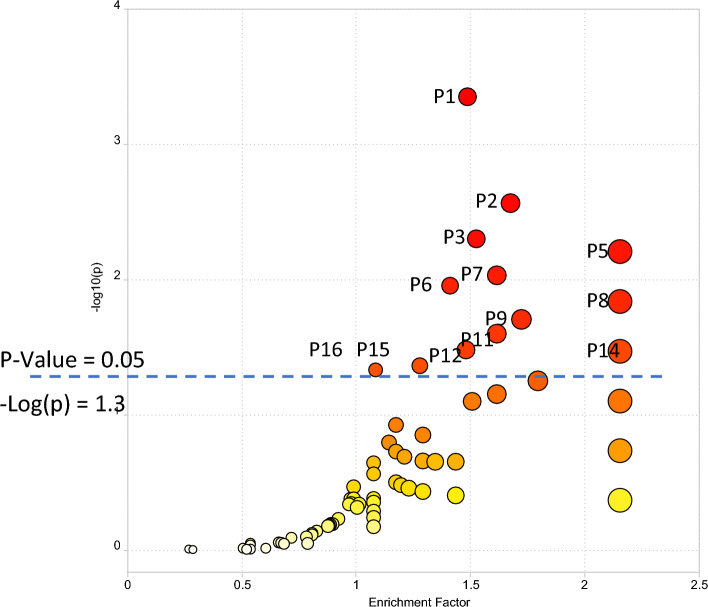
This cross-sectional study investigated differences in the plasma metabolome in two groups of adults that were of similar age but varied markedly in body composition and dietary and physical activity patterns. Study participants included 52 adults in the lifestyle group (LIFE) (28 males, 24 females) and 52 in the control group (CON) (27 males, 25 females). The results using an extensive untargeted ultra high-performance liquid chromatography-high resolution mass spectrometry (UHPLC-HRMS) metabolomics analysis with 10,535 metabolite peaks identified 486 important metabolites (variable influence on projections scores of VIP ≥ 1) and 16 significantly enriched metabolic pathways that differentiated LIFE and CON groups. A novel metabolite signature of positive lifestyle habits emerged from this analysis highlighted by lower plasma levels of numerous bile acids, an amino acid profile characterized by higher histidine and lower glutamic acid, glutamine, β-alanine, phenylalanine, tyrosine, and proline, an elevated vitamin D status, higher levels of beneficial fatty acids and gut microbiome catabolism metabolites from plant substrates, and reduced levels of N-glycan degradation metabolites and environmental contaminants. This study established that the plasma metabolome is strongly associated with body composition and lifestyle habits. The robust lifestyle metabolite signature identified in this study is consistent with an improved life expectancy and a reduced risk for chronic disease.
Keywords: Diet; Lifestyle; Mass spectrometry; Metabolomics; Obesity; Physical activity.
© 2024. The Author(s).
Conflict of interest statement
The authors declare no competing interests.
Figures
Similar articles
-
Multi-omics signature of healthy versus unhealthy lifestyles reveals associations with diseases.Hum Genomics. 2025 Aug 30;19(1):101. doi: 10.1186/s40246-025-00817-7. Hum Genomics. 2025. PMID: 40886004 Free PMC article.
-
Plasma metabolites associated with endometriosis in adolescents and young adults.Hum Reprod. 2025 May 1;40(5):843-854. doi: 10.1093/humrep/deaf040. Hum Reprod. 2025. PMID: 40107296
-
Development of metabolic signatures of plant-rich dietary patterns using plant-derived metabolites.Eur J Nutr. 2024 Nov 28;64(1):29. doi: 10.1007/s00394-024-03511-x. Eur J Nutr. 2024. PMID: 39604558 Free PMC article.
-
Effectiveness and safety of vitamin D in relation to bone health.Evid Rep Technol Assess (Full Rep). 2007 Aug;(158):1-235. Evid Rep Technol Assess (Full Rep). 2007. PMID: 18088161 Free PMC article.
-
Physical activity, diet and other behavioural interventions for improving cognition and school achievement in children and adolescents with obesity or overweight.Cochrane Database Syst Rev. 2018 Mar 2;3(3):CD009728. doi: 10.1002/14651858.CD009728.pub4. Cochrane Database Syst Rev. 2018. PMID: 29499084 Free PMC article.
Cited by
-
A Multiomics Evaluation of the Countermeasure Influence of 4-Week Cranberry Beverage Supplementation on Exercise-Induced Changes in Innate Immunity.Nutrients. 2024 Sep 26;16(19):3250. doi: 10.3390/nu16193250. Nutrients. 2024. PMID: 39408218 Free PMC article. Clinical Trial.
-
Integrating Precision Medicine and Digital Health in Personalized Weight Management: The Central Role of Nutrition.Nutrients. 2025 Aug 20;17(16):2695. doi: 10.3390/nu17162695. Nutrients. 2025. PMID: 40871725 Free PMC article. Review.
-
Constructing a consensus serum metabolome.bioRxiv [Preprint]. 2025 May 11:2025.05.07.652782. doi: 10.1101/2025.05.07.652782. bioRxiv. 2025. PMID: 40654862 Free PMC article. Preprint.
-
Selective Influence of Hemp Fiber Ingestion on Post-Exercise Gut Permeability: A Metabolomics-Based Analysis.Nutrients. 2025 Apr 19;17(8):1384. doi: 10.3390/nu17081384. Nutrients. 2025. PMID: 40284247 Free PMC article. Clinical Trial.
-
The role of dopaminergic medication and specific pathway alterations in idiopathic and PRKN/PINK1-mediated Parkinson's disease.Sci Adv. 2025 May 16;11(20):eadp7063. doi: 10.1126/sciadv.adp7063. Epub 2025 May 14. Sci Adv. 2025. PMID: 40367158 Free PMC article.
References
MeSH terms
Substances
Grants and funding
LinkOut - more resources
Full Text Sources
Medical
